Agricultural and Forestry Production Managers
ISCO-08 1311 · 1 - Managers
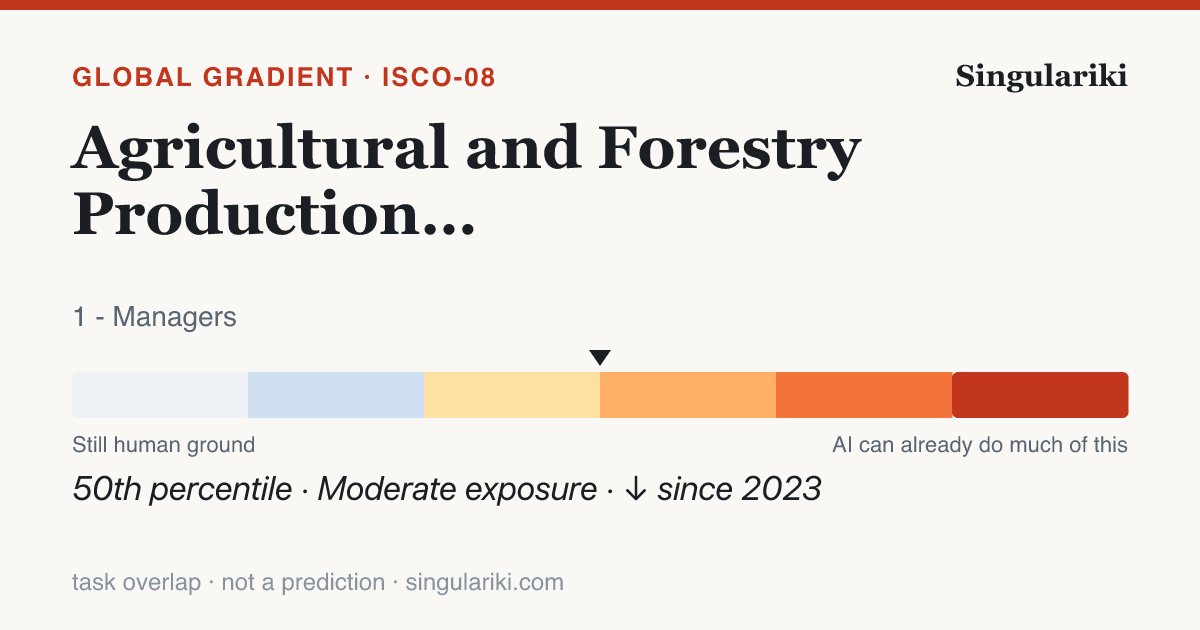
On the International Labour Organization's 2025 global study, the 12 task statements that define Agricultural and Forestry Production Managers (ISCO-08 1311) score an average of 0.27 on a 0–1 exposure scale — more exposed than about 49% of the 427 placed occupations. Roughly 0% of its tasks fall somewhere on the exposed part of the gradient, and the typical task lands in the Minimal band.
Exposure is task overlap, not a verdict. A high score means a generative-AI model can do part of the content of these tasks — it says nothing about whether the work is automated, whether anyone uses AI for it today, or whether jobs are lost. The gradient is scored on the international ISCO-08 system; the rest of Singulariki is U.S. O*NET/SOC, bridged below by an approximate, many-to-many crosswalk.
How its tasks split across the gradient
Each of the 12 scored tasks for this occupation, sorted into the six exposure bands — cool (human ground) to hot (almost fully assistable).
| Band | Tasks | Share | What it means |
|---|---|---|---|
| Not exposed | 0 | 0% | No meaningful GenAI capability on the task |
| Minimal | 12 | 100% | GenAI can touch the edges only |
| Gradient 1 | 0 | 0% | Lightly exposed — small assistable slices |
| Gradient 2 | 0 | 0% | Partly exposed — real assistable share |
| Gradient 3 | 0 | 0% | Heavily exposed — most of the task is assistable |
| Gradient 4 | 0 | 0% | Almost fully exposed |
The most-exposed task
“Establishing and managing budgets, monitoring production output and costs, recording information such as farm management practices, and preparing financial and operational reports;”
Scores 0.57 on the 2025 scale. The task of "Establishing and managing budgets, monitoring production output and costs, recording information such as farm management practices, and preparing financial and operational reports" involves both structured data tasks and analytical decision-making. Generative AI can assist significantly in automating the data processing, report generation, and financial analysis parts of this task, similar to its role in "Performing financial estimates for the purpose of developing a household budget" where it has shown a moderate potential for automation. Given the structured nature of financial and production data management, and similar task adjustments such as "Managing crop documentation and economic documentation" with a score of 0.41 and "Maintaining required breeding and economic documentation" at 0.425, it is reasonable to place this task at a higher automation potential. However, strategic decision-making and oversight still necessitate human involvement, tempered by AI's utility in well-structured and routine tasks. Considering these factors and the high access to advanced technology in Poland, an adjusted score of 0.68 reflects both the potential and limitations of AI in this context.
Moving fastest, 2023 → 2025
“Inspecting plantations and fields to determine maturity dates of crops, or to estimate potential crop damage from weather;”
Model capability on this task changed by +0.15 in two years — the gradient is not static, it is filling in.
U.S. occupations this maps to
The American O*NET/SOC roles that crosswalk to ISCO-08 1311, biggest by employment first, via the published (approximate, many-to-many) IBS O*NET-SOC ↔ ISCO-08 correspondence. These are the closest U.S. matches — not an asserted one-to-one identity.
In context
Part of the 1 - Managers major group. Return to the full gradient to see how the whole group sits.
Write a report on thisheadline · factoids · citation
Agricultural and Forestry Production Managers sit at the 49th percentile of the global GenAI exposure gradient
- Across 427 international occupations scored by the ILO, Agricultural and Forestry Production Managers rank in the 49th percentile for GenAI task exposure — overlap with what generative AI can attempt, not a projection of displacement.ILO / Gmyrek et al. (2025) GenAI exposure gradient
- About 0% of this occupation's tasks fall into an exposed gradient band.ILO / Gmyrek et al. (2025)
- Mean task exposure fell by 0.02 between the 2023 and 2025 model-capability snapshots.ILO / Gmyrek et al. (2025), 2023→2025
- Its most-exposed task: "Establishing and managing budgets, monitoring production output and costs, recording information such as farm management practices, and preparing financial and operational reports;".ILO / Gmyrek et al. (2025)
Agricultural and Forestry Production Managers sit at the 49th percentile of the global GenAI exposure gradient

• Across 427 international occupations scored by the ILO, Agricultural and Forestry Production Managers rank in the 49th percentile for GenAI task exposure — overlap with what generative AI can attempt, not a projection of displacement. (ILO / Gmyrek et al. (2025) GenAI exposure gradient)
• About 0% of this occupation's tasks fall into an exposed gradient band. (ILO / Gmyrek et al. (2025))
• Mean task exposure fell by 0.02 between the 2023 and 2025 model-capability snapshots. (ILO / Gmyrek et al. (2025), 2023→2025)
• Its most-exposed task: "Establishing and managing budgets, monitoring production output and costs, recording information such as farm management practices, and preparing financial and operational reports;". (ILO / Gmyrek et al. (2025))

Source: Singulariki — "Agricultural and Forestry Production Managers". https://singulariki.com/gradient/1311-agricultural-and-forestry-production-managers.html
Note: AI task overlap measures what today's AI can attempt, not automation, job loss, or a forecast.
AssetsShare imageMethodology & sourcesPress & newsroomThe newsroom
Every line is built only from figures this page already shows and cites. AI task overlap means what today's AI can attempt — not automation, job loss, or a forecast.
Datasets behind this page
Every figure above traces to a named public dataset and the exact release below — not hand-written opinion. See the full methodology for what each measure does and does not mean.
- O*NET 30.3 U.S. Department of Labor / National Center for O*NET Development
- ILO / Gmyrek et al. GenAI exposure gradient 2025 International Labour Organization
- IBS O*NET-SOC ↔ ISCO-08 occupation crosswalk 2022 Institute for Structural Research (IBS)