Chemical and Physical Science Technicians
ISCO-08 3111 · 3 - Technicians and associate professionals
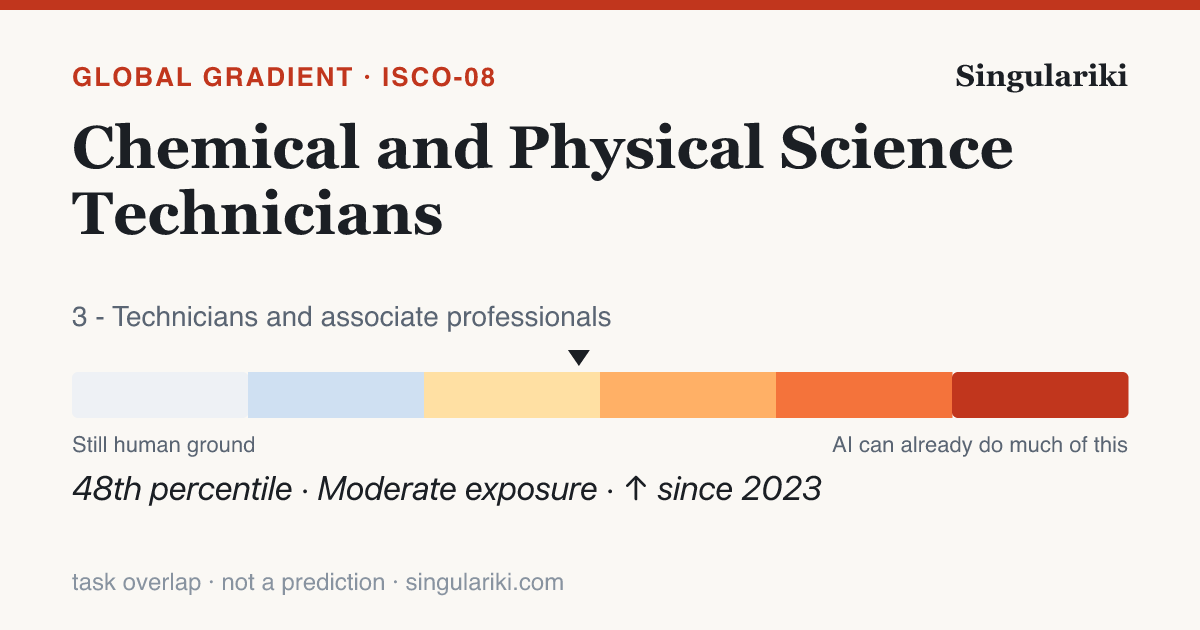
On the International Labour Organization's 2025 global study, the 6 task statements that define Chemical and Physical Science Technicians (ISCO-08 3111) score an average of 0.26 on a 0–1 exposure scale — more exposed than about 47% of the 427 placed occupations. Roughly 0% of its tasks fall somewhere on the exposed part of the gradient, and the typical task lands in the Not exposed band.
Exposure is task overlap, not a verdict. A high score means a generative-AI model can do part of the content of these tasks — it says nothing about whether the work is automated, whether anyone uses AI for it today, or whether jobs are lost. The gradient is scored on the international ISCO-08 system; the rest of Singulariki is U.S. O*NET/SOC, bridged below by an approximate, many-to-many crosswalk.
How its tasks split across the gradient
Each of the 6 scored tasks for this occupation, sorted into the six exposure bands — cool (human ground) to hot (almost fully assistable).
| Band | Tasks | Share | What it means |
|---|---|---|---|
| Not exposed | 6 | 100% | No meaningful GenAI capability on the task |
| Minimal | 0 | 0% | GenAI can touch the edges only |
| Gradient 1 | 0 | 0% | Lightly exposed — small assistable slices |
| Gradient 2 | 0 | 0% | Partly exposed — real assistable share |
| Gradient 3 | 0 | 0% | Heavily exposed — most of the task is assistable |
| Gradient 4 | 0 | 0% | Almost fully exposed |
The most-exposed task
“Controlling the quality and quantity of laboratory supplies by testing samples and monitoring usage and preparing detailed estimates of quantities and costs of materials and labour required for projects, according to the specifications given;”
Scores 0.41 on the 2025 scale. Controlling the quality and quantity of laboratory supplies by testing samples and monitoring usage involves both technical oversight and some level of manual involvement. This task is semantically similar to tasks like "Conducting control of medicines, dressing materials, rescue equipment and tools" and "Evaluating the quality of raw materials, semi-finished products and finished goods for quality assessment," which scored in the range of 0.275 to 0.3525. These tasks involve checking and managing physical items and require human judgment for quality evaluation, which cannot be fully automated by Generative AI. However, AI can assist by analyzing laboratory data, predicting supply needs based on usage trends, and suggesting orders for supplies, increasing efficiency and reducing manual workload. Given that the task is conducted in a high-income country like Poland, where digital tools are accessible, this presents a moderate potential for automation. Therefore, the adjusted score reflects AI's role in supporting but not fully replacing human oversight and manual elements involved in quality control and supply management tasks.
Moving fastest, 2023 → 2025
“Collecting samples and preparing materials and equipment for experiments, tests and analyses;”
Model capability on this task changed by +0.07 in two years — the gradient is not static, it is filling in.
U.S. occupations this maps to
The American O*NET/SOC roles that crosswalk to ISCO-08 3111, biggest by employment first, via the published (approximate, many-to-many) IBS O*NET-SOC ↔ ISCO-08 correspondence. These are the closest U.S. matches — not an asserted one-to-one identity.
- Life, Physical, and Social Science Technicians, All Other
- Quality Control Analysts
- Remote Sensing Technicians
- Chemical Technicians
In context
Part of the 3 - Technicians and associate professionals major group. Return to the full gradient to see how the whole group sits.
Write a report on thisheadline · factoids · citation
Chemical and Physical Science Technicians sit at the 47th percentile of the global GenAI exposure gradient
- Across 427 international occupations scored by the ILO, Chemical and Physical Science Technicians rank in the 47th percentile for GenAI task exposure — overlap with what generative AI can attempt, not a projection of displacement.ILO / Gmyrek et al. (2025) GenAI exposure gradient
- About 0% of this occupation's tasks fall into an exposed gradient band.ILO / Gmyrek et al. (2025)
- Mean task exposure rose by 0.02 between the 2023 and 2025 model-capability snapshots.ILO / Gmyrek et al. (2025), 2023→2025
- Its most-exposed task: "Controlling the quality and quantity of laboratory supplies by testing samples and monitoring usage and preparing detailed estimates of quantities and costs of materials and labour required for projects, according to the specifications given;".ILO / Gmyrek et al. (2025)
Chemical and Physical Science Technicians sit at the 47th percentile of the global GenAI exposure gradient

• Across 427 international occupations scored by the ILO, Chemical and Physical Science Technicians rank in the 47th percentile for GenAI task exposure — overlap with what generative AI can attempt, not a projection of displacement. (ILO / Gmyrek et al. (2025) GenAI exposure gradient)
• About 0% of this occupation's tasks fall into an exposed gradient band. (ILO / Gmyrek et al. (2025))
• Mean task exposure rose by 0.02 between the 2023 and 2025 model-capability snapshots. (ILO / Gmyrek et al. (2025), 2023→2025)
• Its most-exposed task: "Controlling the quality and quantity of laboratory supplies by testing samples and monitoring usage and preparing detailed estimates of quantities and costs of materials and labour required for projects, according to the specifications given;". (ILO / Gmyrek et al. (2025))

Source: Singulariki — "Chemical and Physical Science Technicians". https://singulariki.com/gradient/3111-chemical-and-physical-science-technicians.html
Note: AI task overlap measures what today's AI can attempt, not automation, job loss, or a forecast.
AssetsShare imageMethodology & sourcesPress & newsroomThe newsroom
Every line is built only from figures this page already shows and cites. AI task overlap means what today's AI can attempt — not automation, job loss, or a forecast.
Datasets behind this page
Every figure above traces to a named public dataset and the exact release below — not hand-written opinion. See the full methodology for what each measure does and does not mean.
- O*NET 30.3 U.S. Department of Labor / National Center for O*NET Development
- ILO / Gmyrek et al. GenAI exposure gradient 2025 International Labour Organization
- IBS O*NET-SOC ↔ ISCO-08 occupation crosswalk 2022 Institute for Structural Research (IBS)