Mixed Crop and Animal Producers
ISCO-08 6130 · 6 - Skilled agricultural, forestry and fishery workers
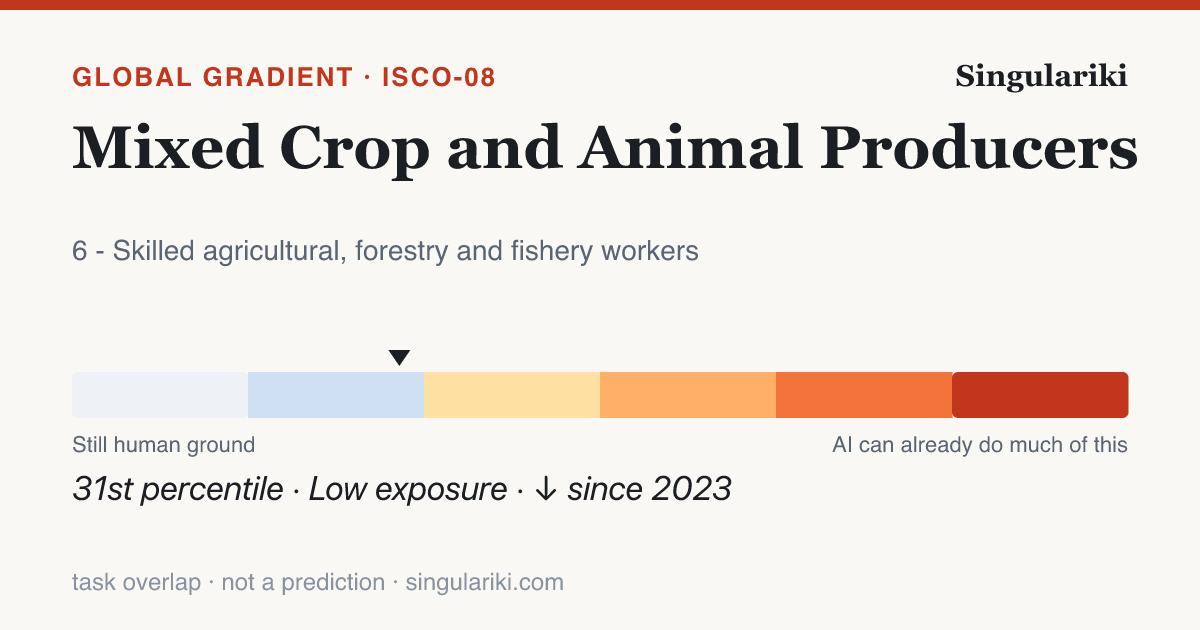
On the International Labour Organization's 2025 global study, the 10 task statements that define Mixed Crop and Animal Producers (ISCO-08 6130) score an average of 0.19 on a 0–1 exposure scale — more exposed than about 30% of the 427 placed occupations. Roughly 0% of its tasks fall somewhere on the exposed part of the gradient, and the typical task lands in the Not exposed band.
Exposure is task overlap, not a verdict. A high score means a generative-AI model can do part of the content of these tasks — it says nothing about whether the work is automated, whether anyone uses AI for it today, or whether jobs are lost. The gradient is scored on the international ISCO-08 system; the rest of Singulariki is U.S. O*NET/SOC, bridged below by an approximate, many-to-many crosswalk.
How its tasks split across the gradient
Each of the 10 scored tasks for this occupation, sorted into the six exposure bands — cool (human ground) to hot (almost fully assistable).
| Band | Tasks | Share | What it means |
|---|---|---|---|
| Not exposed | 10 | 100% | No meaningful GenAI capability on the task |
| Minimal | 0 | 0% | GenAI can touch the edges only |
| Gradient 1 | 0 | 0% | Lightly exposed — small assistable slices |
| Gradient 2 | 0 | 0% | Partly exposed — real assistable share |
| Gradient 3 | 0 | 0% | Heavily exposed — most of the task is assistable |
| Gradient 4 | 0 | 0% | Almost fully exposed |
The most-exposed task
“Monitoring market activity and conditions, determining kinds and amounts of crops to be grown and animals to be raised, and planning and coordinating production accordingly;”
Scores 0.43 on the 2025 scale. The task of monitoring market activity and conditions, determining kinds and amounts of crops to be grown and animals to be raised, and planning and coordinating production aligns well with a strategic decision-making process that can be significantly enhanced by Generative AI, particularly in data analysis and interpreting market trends. Semantically similar tasks, such as planning types and varieties of crops and breeds (score 0.4) and planning strategic farm objectives (score 0.5), reflect moderate to high potential for AI-enhanced support in decision-making and planning. The capabilities of Generative AI to process large datasets, forecast market conditions, and suggest optimal production plans make it a valuable tool in this task. However, the nuances of local environmental conditions and the need for human judgment in final decision-making remain essential. Considering these factors and the context of a high-income country like Poland, which provides robust digital infrastructure, an adjusted score of 0.42 is appropriate. This score reflects the moderate to high potential for automation in certain analytic and planning components while acknowledging the continued necessity for human oversight and expertise in dynamic and localized agricultural contexts.
Moving fastest, 2023 → 2025
“Monitoring market activity and conditions, determining kinds and amounts of crops to be grown and animals to be raised, and planning and coordinating production accordingly;”
Model capability on this task changed by +0.14 in two years — the gradient is not static, it is filling in.
U.S. occupations this maps to
The American O*NET/SOC roles that crosswalk to ISCO-08 6130, biggest by employment first, via the published (approximate, many-to-many) IBS O*NET-SOC ↔ ISCO-08 correspondence. These are the closest U.S. matches — not an asserted one-to-one identity.
- Agricultural Equipment Operators
- First-Line Supervisors of Farming, Fishing, and Forestry Workers
- Animal Breeders
In context
Part of the 6 - Skilled agricultural, forestry and fishery workers major group. Return to the full gradient to see how the whole group sits.
Write a report on thisheadline · factoids · citation
Mixed Crop and Animal Producers sit at the 30th percentile of the global GenAI exposure gradient
- Across 427 international occupations scored by the ILO, Mixed Crop and Animal Producers rank in the 30th percentile for GenAI task exposure — overlap with what generative AI can attempt, not a projection of displacement.ILO / Gmyrek et al. (2025) GenAI exposure gradient
- About 0% of this occupation's tasks fall into an exposed gradient band.ILO / Gmyrek et al. (2025)
- Mean task exposure fell by 0.06 between the 2023 and 2025 model-capability snapshots.ILO / Gmyrek et al. (2025), 2023→2025
- Its most-exposed task: "Monitoring market activity and conditions, determining kinds and amounts of crops to be grown and animals to be raised, and planning and coordinating production accordingly;".ILO / Gmyrek et al. (2025)
Mixed Crop and Animal Producers sit at the 30th percentile of the global GenAI exposure gradient

• Across 427 international occupations scored by the ILO, Mixed Crop and Animal Producers rank in the 30th percentile for GenAI task exposure — overlap with what generative AI can attempt, not a projection of displacement. (ILO / Gmyrek et al. (2025) GenAI exposure gradient)
• About 0% of this occupation's tasks fall into an exposed gradient band. (ILO / Gmyrek et al. (2025))
• Mean task exposure fell by 0.06 between the 2023 and 2025 model-capability snapshots. (ILO / Gmyrek et al. (2025), 2023→2025)
• Its most-exposed task: "Monitoring market activity and conditions, determining kinds and amounts of crops to be grown and animals to be raised, and planning and coordinating production accordingly;". (ILO / Gmyrek et al. (2025))

Source: Singulariki — "Mixed Crop and Animal Producers". https://singulariki.com/gradient/6130-mixed-crop-and-animal-producers.html
Note: AI task overlap measures what today's AI can attempt, not automation, job loss, or a forecast.
AssetsShare imageMethodology & sourcesPress & newsroomThe newsroom
Every line is built only from figures this page already shows and cites. AI task overlap means what today's AI can attempt — not automation, job loss, or a forecast.
Datasets behind this page
Every figure above traces to a named public dataset and the exact release below — not hand-written opinion. See the full methodology for what each measure does and does not mean.
- O*NET 30.3 U.S. Department of Labor / National Center for O*NET Development
- ILO / Gmyrek et al. GenAI exposure gradient 2025 International Labour Organization
- IBS O*NET-SOC ↔ ISCO-08 occupation crosswalk 2022 Institute for Structural Research (IBS)