Medical and Pathology Laboratory Technicians
ISCO-08 3212 · 3 - Technicians and associate professionals
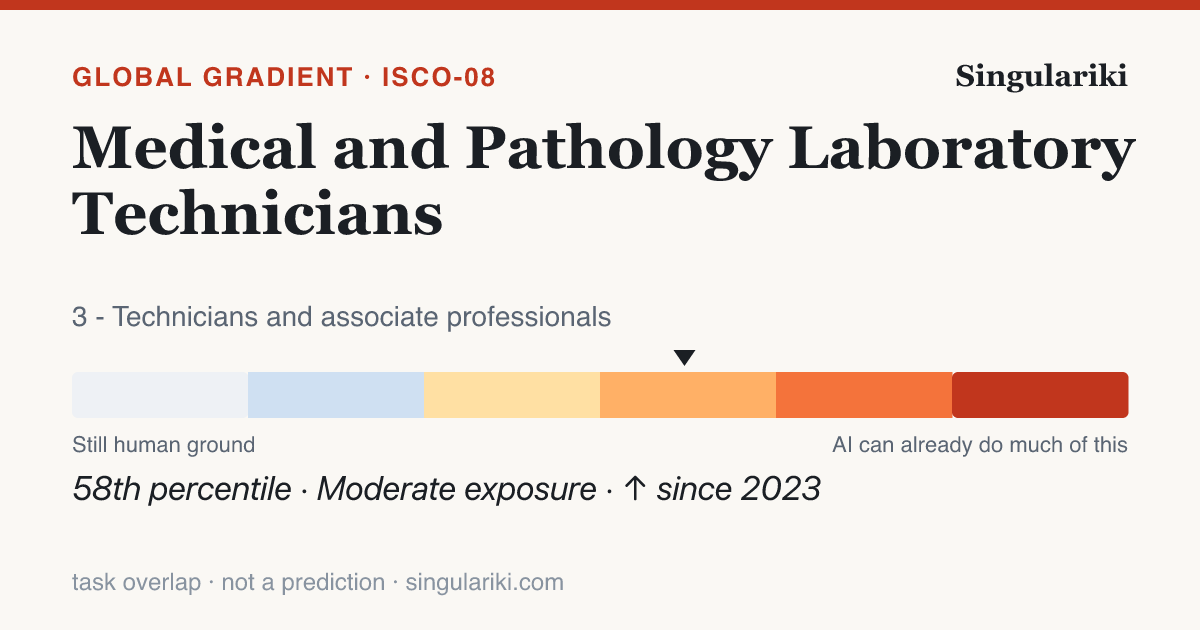
On the International Labour Organization's 2025 global study, the 10 task statements that define Medical and Pathology Laboratory Technicians (ISCO-08 3212) score an average of 0.31 on a 0–1 exposure scale — more exposed than about 58% of the 427 placed occupations. Roughly 0% of its tasks fall somewhere on the exposed part of the gradient, and the typical task lands in the Minimal band.
Exposure is task overlap, not a verdict. A high score means a generative-AI model can do part of the content of these tasks — it says nothing about whether the work is automated, whether anyone uses AI for it today, or whether jobs are lost. The gradient is scored on the international ISCO-08 system; the rest of Singulariki is U.S. O*NET/SOC, bridged below by an approximate, many-to-many crosswalk.
How its tasks split across the gradient
Each of the 10 scored tasks for this occupation, sorted into the six exposure bands — cool (human ground) to hot (almost fully assistable).
| Band | Tasks | Share | What it means |
|---|---|---|---|
| Not exposed | 0 | 0% | No meaningful GenAI capability on the task |
| Minimal | 10 | 100% | GenAI can touch the edges only |
| Gradient 1 | 0 | 0% | Lightly exposed — small assistable slices |
| Gradient 2 | 0 | 0% | Partly exposed — real assistable share |
| Gradient 3 | 0 | 0% | Heavily exposed — most of the task is assistable |
| Gradient 4 | 0 | 0% | Almost fully exposed |
The most-exposed task
“Entering data from analysis of laboratory tests and clinical results into records-keeping systems and reporting results to medical practitioners and other health professionals;”
Scores 0.65 on the 2025 scale. The task of entering data from laboratory tests and clinical results into records-keeping systems and reporting results has a strong potential for automation using Generative AI. This is due to Generative AI's robust capabilities in processing structured data, automating entry, and even pre-populating standard report templates, which align well with tasks such as "Maintaining and storing patient health records" in the clerical support worker context, which has a high adjusted score of 0.575. Similar tasks like "Analyzing and processing computer data" in the professionals category, with a score of 0.55, further illustrate the ability of AI to assist with data processing and record-keeping. The task is repetitive and rule-based, components that AI tools handle well, particularly in environments with strong digital infrastructure like Poland. Although human oversight is necessary to ensure data accuracy and handle exceptions, AI can automate a significant part of the data entry and initial reporting. The proposed score reflects AI's capability to streamline these aspects while acknowledging some necessity for human verification, particularly concerning clinical interpretations and real-time decision-making.
Moving fastest, 2023 → 2025
“Obtaining specimens, cultivating, isolating and identifying microorganisms for analysis;”
Model capability on this task changed by +0.19 in two years — the gradient is not static, it is filling in.
U.S. occupations this maps to
The American O*NET/SOC roles that crosswalk to ISCO-08 3212, biggest by employment first, via the published (approximate, many-to-many) IBS O*NET-SOC ↔ ISCO-08 correspondence. These are the closest U.S. matches — not an asserted one-to-one identity.
- Medical and Clinical Laboratory Technologists
- Cytogenetic Technologists
- Cytotechnologists
- Histotechnologists
- Medical and Clinical Laboratory Technicians
- Histology Technicians
In context
Part of the 3 - Technicians and associate professionals major group. Return to the full gradient to see how the whole group sits.
Write a report on thisheadline · factoids · citation
Medical and Pathology Laboratory Technicians sit at the 58th percentile of the global GenAI exposure gradient
- Across 427 international occupations scored by the ILO, Medical and Pathology Laboratory Technicians rank in the 58th percentile for GenAI task exposure — overlap with what generative AI can attempt, not a projection of displacement.ILO / Gmyrek et al. (2025) GenAI exposure gradient
- About 0% of this occupation's tasks fall into an exposed gradient band.ILO / Gmyrek et al. (2025)
- Mean task exposure rose by 0.01 between the 2023 and 2025 model-capability snapshots.ILO / Gmyrek et al. (2025), 2023→2025
- Its most-exposed task: "Entering data from analysis of laboratory tests and clinical results into records-keeping systems and reporting results to medical practitioners and other health professionals;".ILO / Gmyrek et al. (2025)
Medical and Pathology Laboratory Technicians sit at the 58th percentile of the global GenAI exposure gradient

• Across 427 international occupations scored by the ILO, Medical and Pathology Laboratory Technicians rank in the 58th percentile for GenAI task exposure — overlap with what generative AI can attempt, not a projection of displacement. (ILO / Gmyrek et al. (2025) GenAI exposure gradient)
• About 0% of this occupation's tasks fall into an exposed gradient band. (ILO / Gmyrek et al. (2025))
• Mean task exposure rose by 0.01 between the 2023 and 2025 model-capability snapshots. (ILO / Gmyrek et al. (2025), 2023→2025)
• Its most-exposed task: "Entering data from analysis of laboratory tests and clinical results into records-keeping systems and reporting results to medical practitioners and other health professionals;". (ILO / Gmyrek et al. (2025))

Source: Singulariki — "Medical and Pathology Laboratory Technicians". https://singulariki.com/gradient/3212-medical-and-pathology-laboratory-technicians.html
Note: AI task overlap measures what today's AI can attempt, not automation, job loss, or a forecast.
AssetsShare imageMethodology & sourcesPress & newsroomThe newsroom
Every line is built only from figures this page already shows and cites. AI task overlap means what today's AI can attempt — not automation, job loss, or a forecast.
Datasets behind this page
Every figure above traces to a named public dataset and the exact release below — not hand-written opinion. See the full methodology for what each measure does and does not mean.
- O*NET 30.3 U.S. Department of Labor / National Center for O*NET Development
- ILO / Gmyrek et al. GenAI exposure gradient 2025 International Labour Organization
- IBS O*NET-SOC ↔ ISCO-08 occupation crosswalk 2022 Institute for Structural Research (IBS)