Government Social Benefits Officials
ISCO-08 3353 · 3 - Technicians and associate professionals
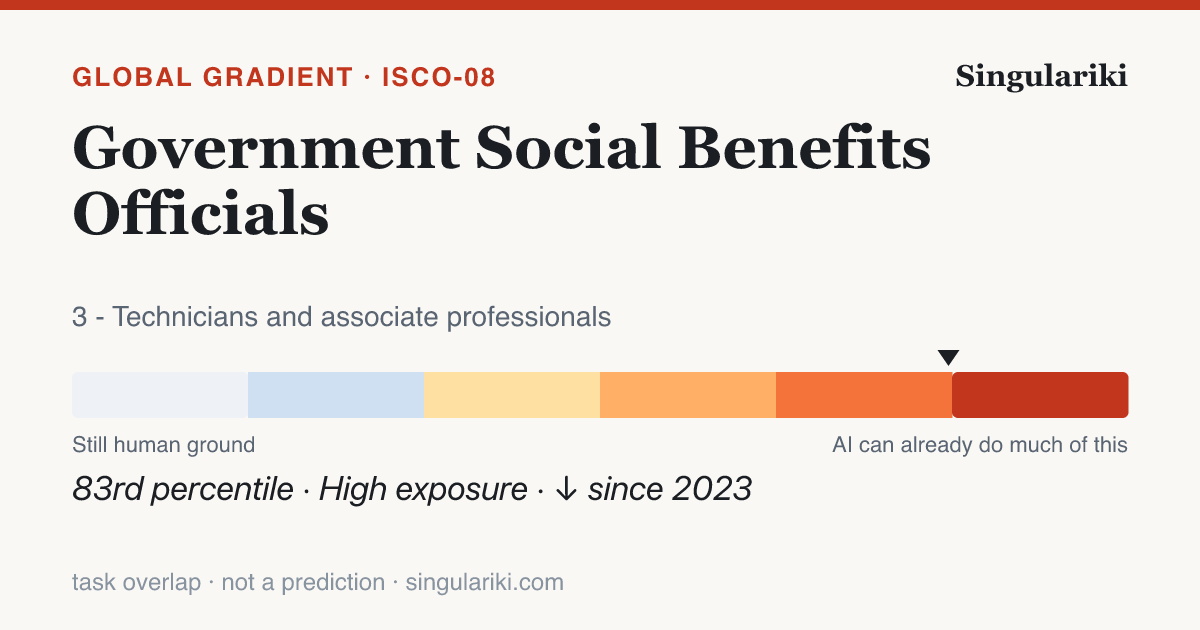
On the International Labour Organization's 2025 global study, the 4 task statements that define Government Social Benefits Officials (ISCO-08 3353) score an average of 0.45 on a 0–1 exposure scale — more exposed than about 83% of the 427 placed occupations. Roughly 100% of its tasks fall somewhere on the exposed part of the gradient, and the typical task lands in the Gradient 2 band.
Exposure is task overlap, not a verdict. A high score means a generative-AI model can do part of the content of these tasks — it says nothing about whether the work is automated, whether anyone uses AI for it today, or whether jobs are lost. The gradient is scored on the international ISCO-08 system; the rest of Singulariki is U.S. O*NET/SOC, bridged below by an approximate, many-to-many crosswalk.
How its tasks split across the gradient
Each of the 4 scored tasks for this occupation, sorted into the six exposure bands — cool (human ground) to hot (almost fully assistable).
| Band | Tasks | Share | What it means |
|---|---|---|---|
| Not exposed | 0 | 0% | No meaningful GenAI capability on the task |
| Minimal | 0 | 0% | GenAI can touch the edges only |
| Gradient 1 | 0 | 0% | Lightly exposed — small assistable slices |
| Gradient 2 | 4 | 100% | Partly exposed — real assistable share |
| Gradient 3 | 0 | 0% | Heavily exposed — most of the task is assistable |
| Gradient 4 | 0 | 0% | Almost fully exposed |
The most-exposed task
“Performing related administrative tasks to maintain client records and prepare reports on determinations regarding eligibility, referral decisions, termination of benefits and abuse or fraud.”
Scores 0.52 on the 2025 scale. The task involves maintaining client records and preparing reports on eligibility, referrals, terminations, and detecting fraud, which includes structured data handling, documentation management, and some degree of analysis and interpretation. Generative AI can assist significantly in automating data entry, processing structured information, and even generating preliminary reports. However, complex decision-making, judgment calls, and ensuring data integrity still require human oversight, especially regarding eligibility determinations and fraud detection. This task's nature aligns with "Maintaining sanitary-epidemiological documentation" (score: 0.355) in that it requires compliance and human interpretation, but may involve more structured data processing similar to "Recording the amount and type of benefits for each employee" (score: 0.41) where repetitive data management tasks were highlighted. Considering the high access to technology in Poland that supports AI utilization, yet recognizing the persistent need for human expertise in complex scenarios, a balanced score of 0.38 reflects the potential for partial automation.
Moving fastest, 2023 → 2025
“Performing related administrative tasks to maintain client records and prepare reports on determinations regarding eligibility, referral decisions, termination of benefits and abuse or fraud.”
Model capability on this task changed by +0.02 in two years — the gradient is not static, it is filling in.
U.S. occupations this maps to
The American O*NET/SOC roles that crosswalk to ISCO-08 3353, biggest by employment first, via the published (approximate, many-to-many) IBS O*NET-SOC ↔ ISCO-08 correspondence. These are the closest U.S. matches — not an asserted one-to-one identity.
- Compliance Officers
- Environmental Compliance Inspectors
- Equal Opportunity Representatives and Officers
- Government Property Inspectors and Investigators
- Coroners
- Regulatory Affairs Specialists
- Customs Brokers
- Eligibility Interviewers, Government Programs
In context
Part of the 3 - Technicians and associate professionals major group. Return to the full gradient to see how the whole group sits.
Write a report on thisheadline · factoids · citation
Government Social Benefits Officials sit at the 83rd percentile of the global GenAI exposure gradient
- Across 427 international occupations scored by the ILO, Government Social Benefits Officials rank in the 83rd percentile for GenAI task exposure — overlap with what generative AI can attempt, not a projection of displacement.ILO / Gmyrek et al. (2025) GenAI exposure gradient
- About 100% of this occupation's tasks fall into an exposed gradient band.ILO / Gmyrek et al. (2025)
- Mean task exposure fell by 0.04 between the 2023 and 2025 model-capability snapshots.ILO / Gmyrek et al. (2025), 2023→2025
- Its most-exposed task: "Performing related administrative tasks to maintain client records and prepare reports on determinations regarding eligibility, referral decisions, termination of benefits and abuse or fraud.".ILO / Gmyrek et al. (2025)
Government Social Benefits Officials sit at the 83rd percentile of the global GenAI exposure gradient

• Across 427 international occupations scored by the ILO, Government Social Benefits Officials rank in the 83rd percentile for GenAI task exposure — overlap with what generative AI can attempt, not a projection of displacement. (ILO / Gmyrek et al. (2025) GenAI exposure gradient)
• About 100% of this occupation's tasks fall into an exposed gradient band. (ILO / Gmyrek et al. (2025))
• Mean task exposure fell by 0.04 between the 2023 and 2025 model-capability snapshots. (ILO / Gmyrek et al. (2025), 2023→2025)
• Its most-exposed task: "Performing related administrative tasks to maintain client records and prepare reports on determinations regarding eligibility, referral decisions, termination of benefits and abuse or fraud.". (ILO / Gmyrek et al. (2025))

Source: Singulariki — "Government Social Benefits Officials". https://singulariki.com/gradient/3353-government-social-benefits-officials.html
Note: AI task overlap measures what today's AI can attempt, not automation, job loss, or a forecast.
AssetsShare imageMethodology & sourcesPress & newsroomThe newsroom
Every line is built only from figures this page already shows and cites. AI task overlap means what today's AI can attempt — not automation, job loss, or a forecast.
Datasets behind this page
Every figure above traces to a named public dataset and the exact release below — not hand-written opinion. See the full methodology for what each measure does and does not mean.
- O*NET 30.3 U.S. Department of Labor / National Center for O*NET Development
- ILO / Gmyrek et al. GenAI exposure gradient 2025 International Labour Organization
- IBS O*NET-SOC ↔ ISCO-08 occupation crosswalk 2022 Institute for Structural Research (IBS)