Research and Development Managers
ISCO-08 1223 · 1 - Managers
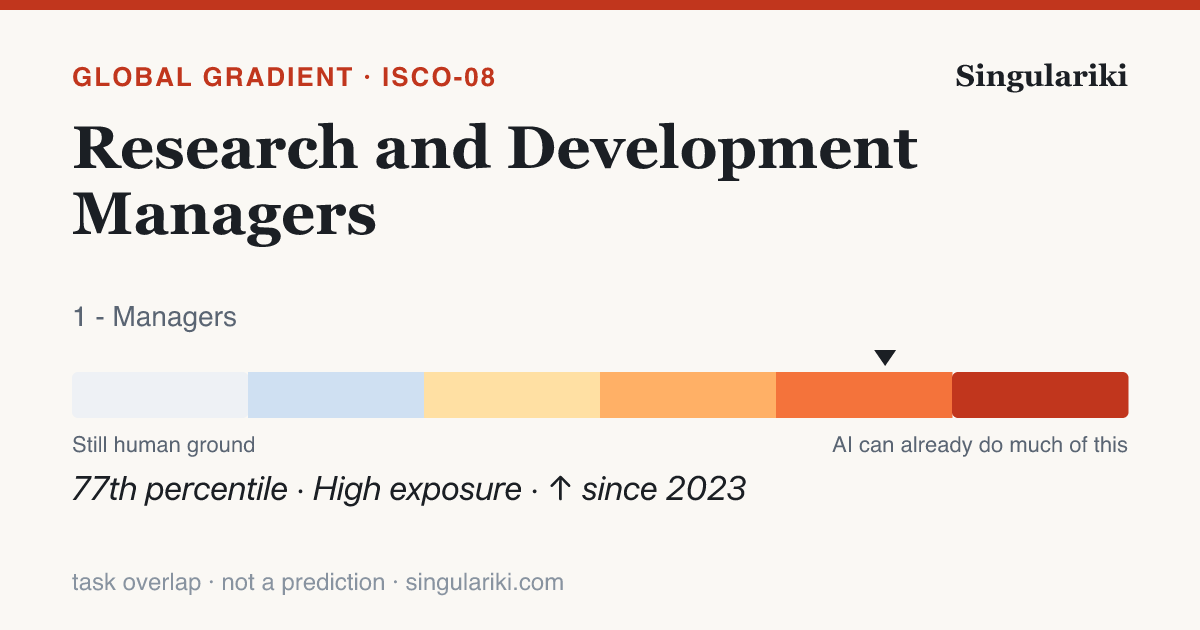
On the International Labour Organization's 2025 global study, the 8 task statements that define Research and Development Managers (ISCO-08 1223) score an average of 0.40 on a 0–1 exposure scale — more exposed than about 77% of the 427 placed occupations. Roughly 0% of its tasks fall somewhere on the exposed part of the gradient, and the typical task lands in the Minimal band.
Exposure is task overlap, not a verdict. A high score means a generative-AI model can do part of the content of these tasks — it says nothing about whether the work is automated, whether anyone uses AI for it today, or whether jobs are lost. The gradient is scored on the international ISCO-08 system; the rest of Singulariki is U.S. O*NET/SOC, bridged below by an approximate, many-to-many crosswalk.
How its tasks split across the gradient
Each of the 8 scored tasks for this occupation, sorted into the six exposure bands — cool (human ground) to hot (almost fully assistable).
| Band | Tasks | Share | What it means |
|---|---|---|---|
| Not exposed | 0 | 0% | No meaningful GenAI capability on the task |
| Minimal | 8 | 100% | GenAI can touch the edges only |
| Gradient 1 | 0 | 0% | Lightly exposed — small assistable slices |
| Gradient 2 | 0 | 0% | Partly exposed — real assistable share |
| Gradient 3 | 0 | 0% | Heavily exposed — most of the task is assistable |
| Gradient 4 | 0 | 0% | Almost fully exposed |
The most-exposed task
“Planning, directing and coordinating research and development activities, in-house or commissioned from external research organizations, to develop new or improved technical processes, products, knowledge, or utilization of materials;”
Scores 0.50 on the 2025 scale. Planning, directing, and coordinating research and development activities involves both strategic oversight and technical expertise, similar to the tasks of directing new company standards and developing strategies for production policies in the provided context. Both tasks have adjusted scores in the range of 0.35 to 0.55, reflecting the moderate potential for AI assistance due to the need for human judgment in strategic and complex decision-making. While Generative AI can help with data analysis, scenario planning, and drafting reports, the nuanced strategic planning and human interaction elements remain challenging for full automation. Given the task's combination of strategic management and technical direction, along with the task being performed in a high-income country like Poland with robust technological infrastructure, the potential for AI to support but not fully automate this role aligns with a score of 0.55. This score acknowledges AI's role in enhancing efficiency and supporting decision-making while still necessitating substantial human oversight to incorporate innovative and context-specific insight.
Moving fastest, 2023 → 2025
“Representing the enterprise or organization at conventions, seminars and conferences.”
Model capability on this task changed by +0.31 in two years — the gradient is not static, it is filling in.
U.S. occupations this maps to
The American O*NET/SOC roles that crosswalk to ISCO-08 1223, biggest by employment first, via the published (approximate, many-to-many) IBS O*NET-SOC ↔ ISCO-08 correspondence. These are the closest U.S. matches — not an asserted one-to-one identity.
- Architectural and Engineering Managers
- Biofuels/Biodiesel Technology and Product Development Managers
- Natural Sciences Managers
- Clinical Research Coordinators
- Water Resource Specialists
In context
Part of the 1 - Managers major group. Return to the full gradient to see how the whole group sits.
Write a report on thisheadline · factoids · citation
Research and Development Managers sit at the 77th percentile of the global GenAI exposure gradient
- Across 427 international occupations scored by the ILO, Research and Development Managers rank in the 77th percentile for GenAI task exposure — overlap with what generative AI can attempt, not a projection of displacement.ILO / Gmyrek et al. (2025) GenAI exposure gradient
- About 0% of this occupation's tasks fall into an exposed gradient band.ILO / Gmyrek et al. (2025)
- Mean task exposure rose by 0.16 between the 2023 and 2025 model-capability snapshots.ILO / Gmyrek et al. (2025), 2023→2025
- Its most-exposed task: "Planning, directing and coordinating research and development activities, in-house or commissioned from external research organizations, to develop new or improved technical processes, products, knowledge, or utilization of materials;".ILO / Gmyrek et al. (2025)
Research and Development Managers sit at the 77th percentile of the global GenAI exposure gradient

• Across 427 international occupations scored by the ILO, Research and Development Managers rank in the 77th percentile for GenAI task exposure — overlap with what generative AI can attempt, not a projection of displacement. (ILO / Gmyrek et al. (2025) GenAI exposure gradient)
• About 0% of this occupation's tasks fall into an exposed gradient band. (ILO / Gmyrek et al. (2025))
• Mean task exposure rose by 0.16 between the 2023 and 2025 model-capability snapshots. (ILO / Gmyrek et al. (2025), 2023→2025)
• Its most-exposed task: "Planning, directing and coordinating research and development activities, in-house or commissioned from external research organizations, to develop new or improved technical processes, products, knowledge, or utilization of materials;". (ILO / Gmyrek et al. (2025))

Source: Singulariki — "Research and Development Managers". https://singulariki.com/gradient/1223-research-and-development-managers.html
Note: AI task overlap measures what today's AI can attempt, not automation, job loss, or a forecast.
AssetsShare imageMethodology & sourcesPress & newsroomThe newsroom
Every line is built only from figures this page already shows and cites. AI task overlap means what today's AI can attempt — not automation, job loss, or a forecast.
Datasets behind this page
Every figure above traces to a named public dataset and the exact release below — not hand-written opinion. See the full methodology for what each measure does and does not mean.
- O*NET 30.3 U.S. Department of Labor / National Center for O*NET Development
- ILO / Gmyrek et al. GenAI exposure gradient 2025 International Labour Organization
- IBS O*NET-SOC ↔ ISCO-08 occupation crosswalk 2022 Institute for Structural Research (IBS)