Statistical, Mathematical and Related Associate Professionals
ISCO-08 3314 · 3 - Technicians and associate professionals
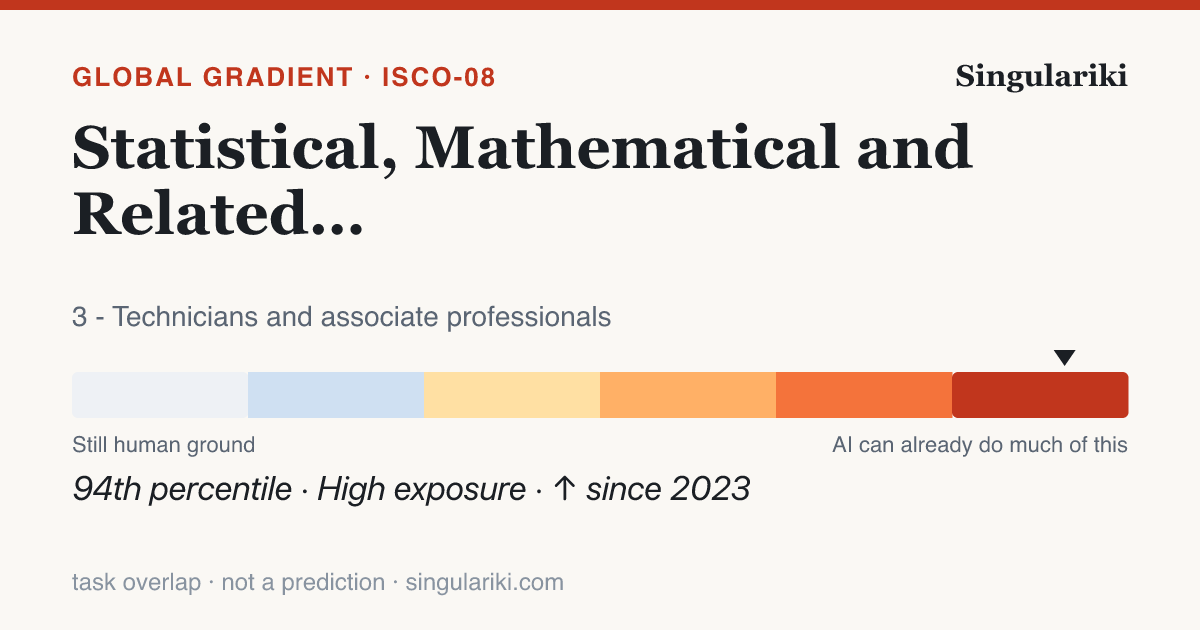
On the International Labour Organization's 2025 global study, the 8 task statements that define Statistical, Mathematical and Related Associate Professionals (ISCO-08 3314) score an average of 0.57 on a 0–1 exposure scale — more exposed than about 94% of the 427 placed occupations. Roughly 100% of its tasks fall somewhere on the exposed part of the gradient, and the typical task lands in the Gradient 3 band.
Exposure is task overlap, not a verdict. A high score means a generative-AI model can do part of the content of these tasks — it says nothing about whether the work is automated, whether anyone uses AI for it today, or whether jobs are lost. The gradient is scored on the international ISCO-08 system; the rest of Singulariki is U.S. O*NET/SOC, bridged below by an approximate, many-to-many crosswalk.
How its tasks split across the gradient
Each of the 8 scored tasks for this occupation, sorted into the six exposure bands — cool (human ground) to hot (almost fully assistable).
| Band | Tasks | Share | What it means |
|---|---|---|---|
| Not exposed | 0 | 0% | No meaningful GenAI capability on the task |
| Minimal | 0 | 0% | GenAI can touch the edges only |
| Gradient 1 | 0 | 0% | Lightly exposed — small assistable slices |
| Gradient 2 | 0 | 0% | Partly exposed — real assistable share |
| Gradient 3 | 8 | 100% | Heavily exposed — most of the task is assistable |
| Gradient 4 | 0 | 0% | Almost fully exposed |
The most-exposed task
“Preparing statistical, mathematical, actuarial, accounting and other results for presentation in graphical or tabular form;”
Scores 0.68 on the 2025 scale. The task of "Preparing statistical, mathematical, actuarial, accounting and other results for presentation in graphical or tabular form" involves data processing and visualization, which aligns well with the strengths of Generative AI in handling structured tasks. Tasks such as "Conducting settlements and financial calculations" and "Opening and closing accounting books," with scores around 0.385 and 0.585 respectively, demonstrate moderate to high potential for automation. These tasks share elements such as data processing and report generation, where Generative AI can automate routine computations and initial report drafts. For creating visual representations, AI can generate templates and suggest formats, although human oversight remains crucial for context-specific interpretation and ensuring the accuracy of statistical presentations. In comparison, more creative tasks like "Preparing expert reports" and "Preparing social assistance plans" scored around 0.65, highlighting the necessity of human judgment for nuanced interpretation. Thus, the adjusted score of 0.68 reflects AI's significant capability in automation, especially in data-driven tasks, while acknowledging the continued need for human intervention in strategic presentation decisions and quality assurance.
Moving fastest, 2023 → 2025
“Performing technical tasks connected with establishing, maintaining and using registers and sampling frames for census and survey operations;”
Model capability on this task changed by +0.47 in two years — the gradient is not static, it is filling in.
U.S. occupations this maps to
The American O*NET/SOC roles that crosswalk to ISCO-08 3314, biggest by employment first, via the published (approximate, many-to-many) IBS O*NET-SOC ↔ ISCO-08 correspondence. These are the closest U.S. matches — not an asserted one-to-one identity.
- Social Science Research Assistants
- Statistical Assistants
- Mathematical Science Occupations, All Other
- Bioinformatics Technicians
In context
Part of the 3 - Technicians and associate professionals major group. Return to the full gradient to see how the whole group sits.
Write a report on thisheadline · factoids · citation
Statistical, Mathematical and Related Associate Professionals sit at the 94th percentile of the global GenAI exposure gradient
- Across 427 international occupations scored by the ILO, Statistical, Mathematical and Related Associate Professionals rank in the 94th percentile for GenAI task exposure — overlap with what generative AI can attempt, not a projection of displacement.ILO / Gmyrek et al. (2025) GenAI exposure gradient
- About 100% of this occupation's tasks fall into an exposed gradient band.ILO / Gmyrek et al. (2025)
- Mean task exposure rose by 0.08 between the 2023 and 2025 model-capability snapshots.ILO / Gmyrek et al. (2025), 2023→2025
- Its most-exposed task: "Preparing statistical, mathematical, actuarial, accounting and other results for presentation in graphical or tabular form;".ILO / Gmyrek et al. (2025)
Statistical, Mathematical and Related Associate Professionals sit at the 94th percentile of the global GenAI exposure gradient

• Across 427 international occupations scored by the ILO, Statistical, Mathematical and Related Associate Professionals rank in the 94th percentile for GenAI task exposure — overlap with what generative AI can attempt, not a projection of displacement. (ILO / Gmyrek et al. (2025) GenAI exposure gradient)
• About 100% of this occupation's tasks fall into an exposed gradient band. (ILO / Gmyrek et al. (2025))
• Mean task exposure rose by 0.08 between the 2023 and 2025 model-capability snapshots. (ILO / Gmyrek et al. (2025), 2023→2025)
• Its most-exposed task: "Preparing statistical, mathematical, actuarial, accounting and other results for presentation in graphical or tabular form;". (ILO / Gmyrek et al. (2025))

Source: Singulariki — "Statistical, Mathematical and Related Associate Professionals". https://singulariki.com/gradient/3314-statistical-mathematical-and-related-associate-professionals.html
Note: AI task overlap measures what today's AI can attempt, not automation, job loss, or a forecast.
AssetsShare imageMethodology & sourcesPress & newsroomThe newsroom
Every line is built only from figures this page already shows and cites. AI task overlap means what today's AI can attempt — not automation, job loss, or a forecast.
Datasets behind this page
Every figure above traces to a named public dataset and the exact release below — not hand-written opinion. See the full methodology for what each measure does and does not mean.
- O*NET 30.3 U.S. Department of Labor / National Center for O*NET Development
- ILO / Gmyrek et al. GenAI exposure gradient 2025 International Labour Organization
- IBS O*NET-SOC ↔ ISCO-08 occupation crosswalk 2022 Institute for Structural Research (IBS)