Agriculture, Forestry, Fishing and Hunting
Sector · NAICS 11
A source-stamped Markdown brief of this occupation — paste it into an agent, or fetch
/industries/11/context.md directly.
Agriculture, Forestry, Fishing and Hunting is a U.S. industry in the NAICS classification. The Bureau of Labor Statistics estimates about 423,370 workers across 151 detailed occupations in it. A typical worker earns around $41,450 a year (Singulariki estimate, see below).
The Sector as a Whole The Agriculture, Forestry, Fishing and Hunting sector comprises establishments primarily engaged in growing crops, raising animals, harvesting timber, and harvesting fish and other animals from a farm, ranch, or their natural habitats. The establishments in this sector are often described as farms, ranches, dairies, greenhouses, nurseries, orchards, or hatcheries. A farm may consist of a single tract of land or a number of separate tracts which may be held under different tenures. For example, one tract may be owned by the farm operator and another rented. It may be operated by the operator alone or with the assistance of members of the household or hired employees, or it may be operated by a partnership, corporation, or other type of organization. When a landowner has one or more tenants, renters, croppers, or managers, the land operated by each is considered a farm. The sector distinguishes two basic activities: agricultural production and agricultural support activities. Agricultural production includes establishments performing the complete farm or ranch operation, such as farm owner-operators and tenant farm operators. Agricultural support activities include establishments that perform one or more activities associated with farm operation, such as soil preparation, planting, harvesting, and management, on a contract or fee basis. Excluded from the Agriculture, Forestry, Fishing and Hunting sector are establishments primarily engaged in agricultural research (e.g., experimental farms) and government establishments primarily engaged in administering programs for regulating and conserving land, mineral, wildlife, and forest use. These establishments are classified in Industry 54171, Research and Development in the Physical, Engineering, and Life Sciences; and Industry 92412, Administration of Conservation Programs, respectively.
Employment is national May 2024 OEWS. "Typical pay" is Singulariki's own figure — the employment-weighted average of each occupation's national median wage — a rough center of the industry, not an official BLS number.
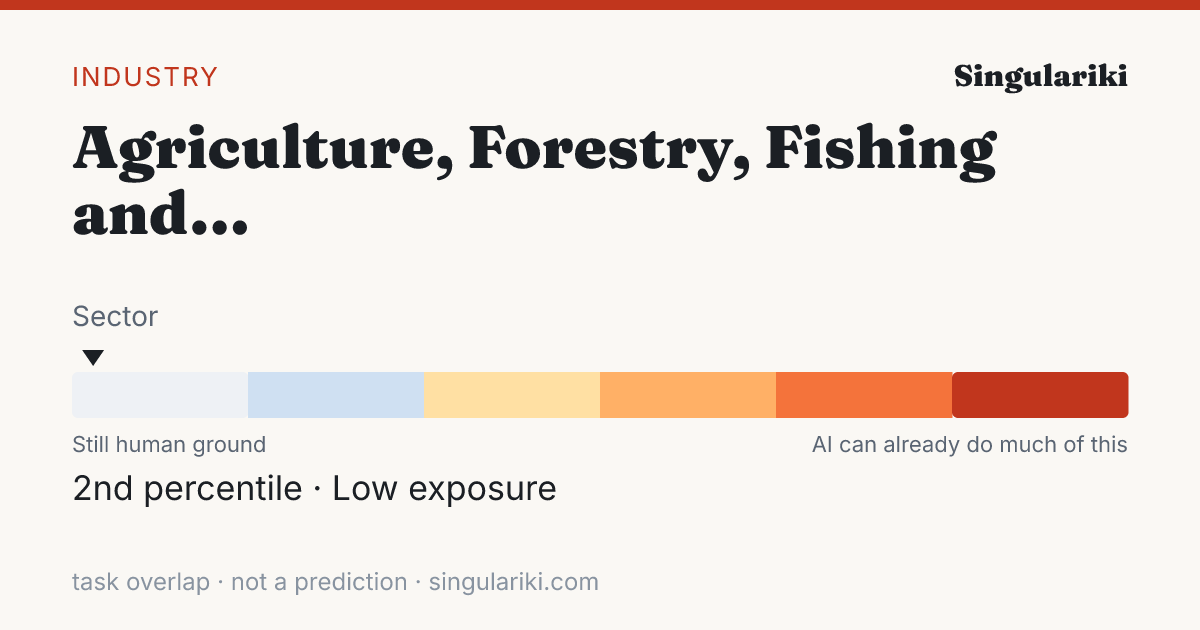
How exposed this industry is to AI
Weighting every occupation in this industry by its employment and its unified AI-exposure index (the OpenAI "GPTs are GPTs" human-rated task overlap folded with the Felten/Raj/Seamans AIOE index), this industry sits in the Low band — 2nd percentile across all industries.
Exposure measures how much of the work overlaps with what today's AI can do, not a prediction of automation; high-exposure industries are where AI is most likely to reshape tasks. Employment-weighted across 134 occupations that carry an exposure score. Compare every industry on the AI exposure hub.
How AI is actually used in this industry
Among measured Claude.ai (Free and Pro) conversations mapped to O*NET task statements (Anthropic Economic Index, 2026-01-15), these patterns are most associated with the occupations in this industry, weighted by its employment mix. They are shares of observed AI conversations — not of worker time, revenue, or what could be automated — and reflect one AI assistant's consumer sample, not all AI.
| Signal coverage | 62.0% of employment · 70/143 occupations have AEI task data |
| Augmentation vs. automation | 52.0% working with AI · 41.8% handed to AI |
| Most common pattern | Directive · AI does it; you give the instruction |
| Typical AI autonomy | 3.9 / 5 · higher = AI acts more independently |
Tasks driving the signal
The task families that account for the most AI activity across this industry's occupations (employment × observed usage), each attributed to the occupation it comes from.
| Task | Occupation | How | Share of signal |
|---|---|---|---|
| Provide information and advice to the public regarding the selection, purchase, and care of products. | Farmworkers and Laborers, Crop, Nursery, and Greenhouse | Directive | 80.6% |
| Troubleshoot problems involving office equipment, such as computer hardware and software. | Office Clerks, General | Feedback loop | 10.0% |
| Participate in the inspection, grading, sorting, storage, and post-harvest treatment of crops. | Farmworkers and Laborers, Crop, Nursery, and Greenhouse | Directive | 1.1% |
| Use computers for various applications, such as database management or word processing. | Secretaries and Administrative Assistants, Except Legal, Medical, and Executive | Directive | 0.8% |
| Conduct searches to find needed information, using such sources as the Internet. | Secretaries and Administrative Assistants, Except Legal, Medical, and Executive | Directive | 0.8% |
| Develop or maintain internal or external company Web sites. | Secretaries and Administrative Assistants, Except Legal, Medical, and Executive | Directive | 0.6% |
| Process and prepare documents, such as business or government forms and expense reports. | Office Clerks, General | Directive | 0.4% |
| Participate in the work of subordinates to facilitate productivity or to overcome difficult aspects of work. | First-Line Supervisors of Office and Administrative Support Workers | Iteration | 0.4% |
| Complete work schedules, manage calendars, and arrange appointments. | Office Clerks, General | Directive | 0.2% |
| Answer customers' questions about products, prices, availability, product uses, and credit terms. | Sales Representatives, Wholesale and Manufacturing, Except Technical and Scientific Products | Learning | 0.2% |
| Classify, record, and summarize numerical and financial data to compile and keep financial records, using journals and ledgers or computers. | Bookkeeping, Accounting, and Auditing Clerks | Directive | 0.2% |
| Operate office machines, such as photocopiers and scanners, facsimile machines, voice mail systems, and personal computers. | Office Clerks, General | Learning | 0.2% |
Occupations behind the signal
The occupations whose AI-touched tasks contribute most to this industry's signal, by employment here.
| Occupation | Workers | Share | How they use AI |
|---|---|---|---|
| Farmworkers and Laborers, Crop, Nursery, and Greenhouse | 195,350 | 46.1% | Directive |
| Heavy and Tractor-Trailer Truck Drivers | 13,550 | 3.2% | Directive |
| Office Clerks, General | 7,140 | 1.7% | Feedback loop |
| General and Operations Managers | 5,940 | 1.4% | Iteration |
| Bookkeeping, Accounting, and Auditing Clerks | 4,120 | 1.0% | Directive |
| Maintenance and Repair Workers, General | 3,280 | 0.8% | Learning |
| Inspectors, Testers, Sorters, Samplers, and Weighers | 2,810 | 0.7% | Directive |
| Secretaries and Administrative Assistants, Except Legal, Medical, and Executive | 2,700 | 0.6% | Directive |
| Farmers, Ranchers, and Other Agricultural Managers | 2,560 | 0.6% | Learning |
| Shipping, Receiving, and Inventory Clerks | 2,260 | 0.5% | Iteration |
| Landscaping and Groundskeeping Workers | 1,700 | 0.4% | Learning |
| First-Line Supervisors of Office and Administrative Support Workers | 1,680 | 0.4% | Iteration |
This rollup is only as complete as the occupation-task matches available for the industry; the coverage figure above is shown so sparse industries do not look falsely precise. AI exposure is not the same as replacement.
Skill & tool metabolism
What this industry's work actually runs on. Each figure is the share of the industry's workers in occupations that significantly rely on a skill, knowledge area, or ability (O*NET importance ≥ 3 of 5), or that use a tool category — its employment reach. This is a measure of how widespread a requirement is across the workforce, not how intensively any one worker uses it. Shares are independent and need not add to 100%.
Based on 98.2% of this industry's employment that maps to a detailed occupation with an O*NET skill profile.
Skills
| Skill | Employment reach | Workers |
|---|---|---|
| Operations Monitoring | 74.3% | 314,400 |
| Speaking | 72.8% | 308,230 |
| Monitoring | 37.3% | 157,970 |
| Active Listening | 37.2% | 157,300 |
| Critical Thinking | 27.0% | 114,250 |
| Operation and Control | 27.0% | 114,150 |
| Reading Comprehension | 26.8% | 113,370 |
| Time Management | 23.9% | 101,180 |
| Coordination | 23.2% | 98,050 |
| Judgment and Decision Making | 20.7% | 87,620 |
| Troubleshooting | 19.3% | 81,520 |
| Complex Problem Solving | 17.2% | 72,750 |
Knowledge areas
| Knowledge area | Employment reach | Workers |
|---|---|---|
| English Language | 38.4% | 162,720 |
| Customer and Personal Service | 32.0% | 135,280 |
| Production and Processing | 29.8% | 126,010 |
| Mathematics | 21.1% | 89,540 |
| Administration and Management | 19.7% | 83,400 |
| Mechanical | 18.3% | 77,580 |
| Public Safety and Security | 14.5% | 61,420 |
| Education and Training | 11.1% | 46,820 |
| Administrative | 10.5% | 44,510 |
| Biology | 8.7% | 36,710 |
| Computers and Electronics | 8.2% | 34,810 |
| Food Production | 7.9% | 33,410 |
Abilities
| Abilitie | Employment reach | Workers |
|---|---|---|
| Near Vision | 98.2% | 415,920 |
| Oral Comprehension | 97.1% | 411,140 |
| Problem Sensitivity | 92.9% | 393,350 |
| Oral Expression | 89.2% | 377,510 |
| Manual Dexterity | 86.3% | 365,570 |
| Speech Recognition | 84.2% | 356,460 |
| Deductive Reasoning | 79.6% | 337,110 |
| Speech Clarity | 78.7% | 333,260 |
| Arm-Hand Steadiness | 78.6% | 332,850 |
| Multilimb Coordination | 77.7% | 328,850 |
| Control Precision | 76.1% | 322,320 |
| Trunk Strength | 76.1% | 322,150 |
Tool categories
| Tool category | Employment reach | Workers |
|---|---|---|
| Spreadsheet software | 97.7% | 413,790 |
| Office suite software | 93.9% | 397,340 |
| Word processing software | 92.9% | 393,150 |
| Data base user interface and query software | 87.6% | 370,980 |
| Electronic mail software | 85.1% | 360,370 |
| Presentation software | 73.7% | 312,030 |
| Internet browser software | 67.7% | 286,650 |
| Mobile location based services software | 47.3% | 200,170 |
| Enterprise resource planning ERP software | 40.1% | 169,610 |
| Inventory management software | 25.2% | 106,760 |
| Operating system software | 17.3% | 73,430 |
| Computer aided design CAD software | 15.1% | 64,140 |
| Calendar and scheduling software | 15.0% | 63,390 |
| Project management software | 14.1% | 59,690 |
| Accounting software | 13.7% | 57,980 |
Reach = share of industry employment in occupations where the requirement is significant; it is not a per-worker usage or proficiency measure. Skill, knowledge, and ability importance is from O*NET; tool use is reported presence of a technology category.
Largest occupations
The occupations that employ the most people in this industry, with their share of the industry's workforce and national median pay for the occupation (not industry-specific pay).
Showing the top 40 of 151 occupations by employment.
Most distinctive occupations
The occupations most unusually concentrated in this industry compared with the economy as a whole. The location quotient is how many times more common an occupation is here versus its economy-wide share (a value of 5 means five times as concentrated).
For a sector this broad, the location quotient has a ceiling set by the sector's own share of national employment, so the top values tend to cluster near that limit.
| Occupation | Concentration | Workers |
|---|---|---|
| Farm Labor Contractors | 319.77× | 360 |
| Logging Workers, All Other | 300.12× | 1,780 |
| Logging Equipment Operators | 279.61× | 17,290 |
| Farmworkers and Laborers, Crop, Nursery, and Greenhouse | 271.86× | 195,350 |
| Fallers | 232.16× | 2,620 |
| First-Line Supervisors of Farming, Fishing, and Forestry Workers | 188.94× | 15,320 |
| Agricultural Equipment Operators | 188.57× | 16,020 |
| Animal Breeders | 170.52× | 810 |
| Farmers, Ranchers, and Other Agricultural Managers | 157.75× | 2,560 |
| Graders and Sorters, Agricultural Products | 145.16× | 10,710 |
| Farmworkers, Farm, Ranch, and Aquacultural Animals | 130.38× | 12,680 |
| Agricultural Workers, All Other | 73.13× | 1,000 |
| Animal Scientists | 42.76× | 290 |
| Farm Equipment Mechanics and Service Technicians | 31.5× | 3,190 |
| Animal Trainers | 30.06× | 1,660 |
| Agricultural Technicians | 27.43× | 1,080 |
| Foresters | 23.78× | 630 |
| Pesticide Handlers, Sprayers, and Applicators, Vegetation | 18.35× | 1,270 |
| Soil and Plant Scientists | 17.11× | 780 |
| Agricultural Inspectors | 15.06× | 500 |
Write a report on thisheadline · factoids · citation
The Agriculture, Forestry, Fishing and Hunting workforce sits at the 2nd percentile of AI task overlap — 423,370 U.S. workers
- Weighting every occupation by its real share of Agriculture, Forestry, Fishing and Hunting employment, the industry's workforce ranks in the 2nd percentile (Low band) for AI task overlap — overlap with what AI can attempt, not a measure of jobs at risk.Eloundou et al. + Felten AIOE, weighted by BLS OEWS
- The industry employs about 423,370 U.S. workers across 151 occupations.BLS OEWS (May 2024)
- Employment-weighted typical annual pay is about $41,450.BLS OEWS (May 2024)
- Of AI use observed across this industry's occupations, 52% looks like augmentation rather than automation — from a Claude.ai sample, not a census.Anthropic Economic Index
The Agriculture, Forestry, Fishing and Hunting workforce sits at the 2nd percentile of AI task overlap — 423,370 U.S. workers

• Weighting every occupation by its real share of Agriculture, Forestry, Fishing and Hunting employment, the industry's workforce ranks in the 2nd percentile (Low band) for AI task overlap — overlap with what AI can attempt, not a measure of jobs at risk. (Eloundou et al. + Felten AIOE, weighted by BLS OEWS)
• The industry employs about 423,370 U.S. workers across 151 occupations. (BLS OEWS (May 2024))
• Employment-weighted typical annual pay is about $41,450. (BLS OEWS (May 2024))
• Of AI use observed across this industry's occupations, 52% looks like augmentation rather than automation — from a Claude.ai sample, not a census. (Anthropic Economic Index)

Source: Singulariki — "Agriculture, Forestry, Fishing and Hunting". https://singulariki.com/industries/11
Note: AI task overlap measures what today's AI can attempt, not automation, job loss, or a forecast.
AssetsShare imageMethodology & sourcesPress & newsroomThe newsroom
Every line is built only from figures this page already shows and cites. AI task overlap means what today's AI can attempt — not automation, job loss, or a forecast.
Sources for this page
Every figure above traces to a named public dataset and the exact release below — not hand-written opinion. See the full methodology for what each measure does and does not mean.
- O*NET 30.3 U.S. Department of Labor / National Center for O*NET Development
- BLS Occupational Employment and Wage Statistics (OEWS) May 2024 U.S. Bureau of Labor Statistics
- Census NAICS 2022 U.S. Census Bureau
- Anthropic Economic Index v4 (2026-01-15) + v2 (2025-03-27) Anthropic
- “GPTs are GPTs” (Eloundou et al.) arXiv 2303.10130 OpenAI / academic
- AI Occupational Exposure (AIOE) Felten, Raj & Seamans academic
Data compiled June 3, 2026. Figures are estimates, not advice.
Cite this page
Singulariki. "Agriculture, Forestry, Fishing and Hunting." Singulariki: a source-backed encyclopedia of work. Built from O*NET 30.3; BLS Occupational Employment and Wage Statistics (OEWS) May 2024; Census NAICS 2022; Anthropic Economic Index v4 (2026-01-15) + v2 (2025-03-27); “GPTs are GPTs” (Eloundou et al.) arXiv 2303.10130; AI Occupational Exposure (AIOE) Felten, Raj & Seamans. Accessed June 7, 2026. https://singulariki.com/industries/11
Singulariki. (2026). Agriculture, Forestry, Fishing and Hunting. Singulariki: a source-backed encyclopedia of work. Retrieved June 7, 2026, from https://singulariki.com/industries/11
@misc{singulariki-11,
  title  = {Agriculture, Forestry, Fishing and Hunting},
  author = {{Singulariki}},
  year   = {2026},
  note   = {O*NET 30.3; BLS Occupational Employment and Wage Statistics (OEWS) May 2024; Census NAICS 2022; Anthropic Economic Index v4 (2026-01-15) + v2 (2025-03-27); “GPTs are GPTs” (Eloundou et al.) arXiv 2303.10130; AI Occupational Exposure (AIOE) Felten, Raj & Seamans. Accessed June 7, 2026},
  url    = {https://singulariki.com/industries/11}
} Citations name the underlying public dataset releases — they reflect what this page is built from, not just the URL.