Mining, Quarrying, and Oil and Gas Extraction
Sector · NAICS 21
A source-stamped Markdown brief of this occupation — paste it into an agent, or fetch
/industries/21/context.md directly.
Mining, Quarrying, and Oil and Gas Extraction is a U.S. industry in the NAICS classification. The Bureau of Labor Statistics estimates about 573,480 workers across 243 detailed occupations in it. A typical worker earns around $75,083 a year (Singulariki estimate, see below).
The Sector as a Whole The Mining, Quarrying, and Oil and Gas Extraction sector comprises establishments that extract naturally occurring mineral solids, such as coal and ores; liquid minerals, such as crude petroleum; and gases, such as natural gas. The term "mining" is used in the broad sense to include quarrying, well operations, beneficiating (e.g., crushing, screening, washing, and flotation), and other preparation customarily performed at the mine site, or as a part of mining activity. The Mining, Quarrying, and Oil and Gas Extraction sector distinguishes two basic activities: mine operation and mining support activities. Mine operation includes establishments operating mines, quarries, or oil and gas wells on their own account or for others on a contract or fee basis. Mining support activities include establishments that perform exploration (except geophysical surveying and mapping) on a contract or fee basis and/or other mining services on a contract or fee basis (except mine site preparation, construction, and transportation activities). Establishments in the Mining, Quarrying, and Oil and Gas Extraction sector are grouped and classified according to the natural resource mined or to be mined. Industries include establishments that develop and/or operate the mine site, extract the natural resources, beneficiate (i.e., prepare) the mineral mined, or provide mining support activities. Beneficiation is the process whereby the extracted material is reduced to particles that can be separated into mineral and waste, the former suitable for further processing or direct use. The operations that take place in beneficiation are primarily mechanical, such as grinding, washing, magnetic separation, and centrifugal separation. In contrast, manufacturing operations primarily use chemical and electrochemical processes, such as electrolysis and distillation. However, some treatments, such as heat treatments, take place in both the beneficiation and the manufacturing (i.e., smelting/refining) stages. The range of preparation activities varies by mineral and the purity of any given ore deposit. While some minerals, such as petroleum and natural gas, require little or no preparation, others are washed and screened, while yet others, such as gold and silver, can be transformed into bullion before leaving the mine site. Mining, beneficiating, and manufacturing activities often occur in a single location. Separate receipts will be collected for these activities whenever possible. When receipts cannot be broken out between mining and manufacturing, establishments that mine or quarry nonmetallic minerals, and then beneficiate the nonmetallic minerals into more finished manufactured products are classified based on the primary activity of the establishment. A mine that manufactures a small amount of finished products will be classified in Sector 21, Mining, Quarrying, and Oil and Gas Extraction. An establishment that mines whose primary output is a more finished manufactured product will be classified in Sector 31-33, Manufacturing.
Employment is national May 2024 OEWS. "Typical pay" is Singulariki's own figure — the employment-weighted average of each occupation's national median wage — a rough center of the industry, not an official BLS number.
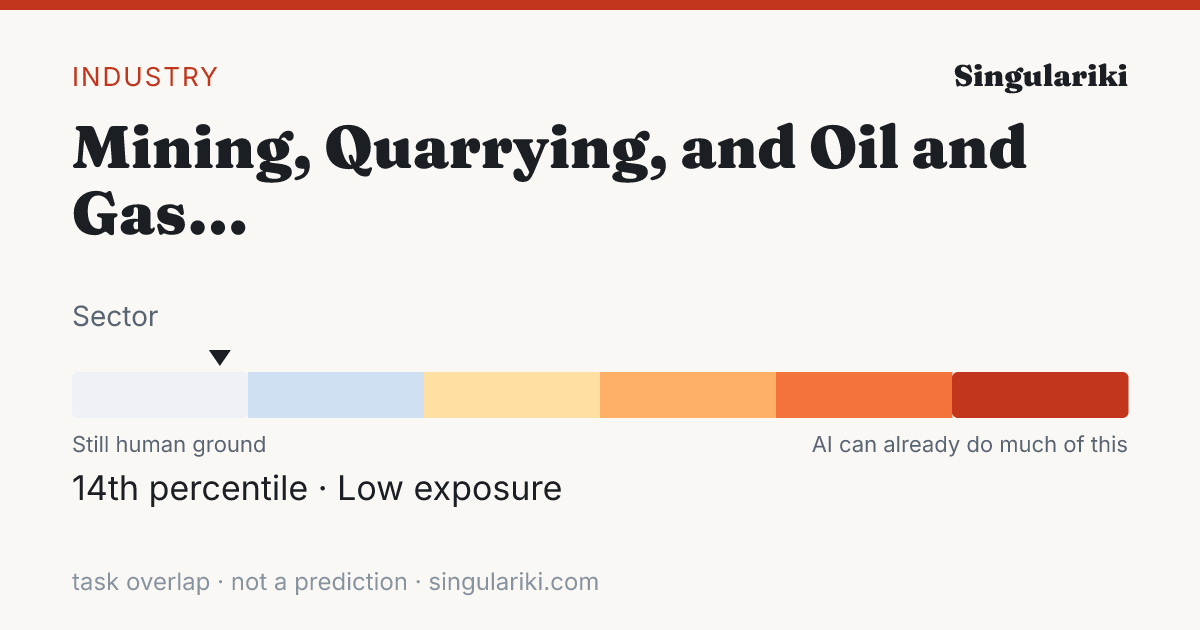
How exposed this industry is to AI
Weighting every occupation in this industry by its employment and its unified AI-exposure index (the OpenAI "GPTs are GPTs" human-rated task overlap folded with the Felten/Raj/Seamans AIOE index), this industry sits in the Low band — 14th percentile across all industries.
Exposure measures how much of the work overlaps with what today's AI can do, not a prediction of automation; high-exposure industries are where AI is most likely to reshape tasks. Employment-weighted across 208 occupations that carry an exposure score. Compare every industry on the AI exposure hub.
How AI is actually used in this industry
Among measured Claude.ai (Free and Pro) conversations mapped to O*NET task statements (Anthropic Economic Index, 2026-01-15), these patterns are most associated with the occupations in this industry, weighted by its employment mix. They are shares of observed AI conversations — not of worker time, revenue, or what could be automated — and reflect one AI assistant's consumer sample, not all AI.
| Signal coverage | 44.3% of employment · 107/223 occupations have AEI task data |
| Augmentation vs. automation | 37.7% working with AI · 41.1% handed to AI |
| Most common pattern | Directive · AI does it; you give the instruction |
| Typical AI autonomy | 3.5 / 5 · higher = AI acts more independently |
Tasks driving the signal
The task families that account for the most AI activity across this industry's occupations (employment × observed usage), each attributed to the occupation it comes from.
| Task | Occupation | How | Share of signal |
|---|---|---|---|
| Troubleshoot problems involving office equipment, such as computer hardware and software. | Office Clerks, General | Feedback loop | 34.0% |
| Use computers for various applications, such as database management or word processing. | Secretaries and Administrative Assistants, Except Legal, Medical, and Executive | Directive | 5.3% |
| Conduct searches to find needed information, using such sources as the Internet. | Secretaries and Administrative Assistants, Except Legal, Medical, and Executive | Directive | 4.9% |
| Develop or maintain internal or external company Web sites. | Secretaries and Administrative Assistants, Except Legal, Medical, and Executive | Directive | 3.7% |
| Enter codes and instructions to program computer-controlled machinery. | Industrial Machinery Mechanics | Directive | 2.5% |
| Participate in the work of subordinates to facilitate productivity or to overcome difficult aspects of work. | First-Line Supervisors of Office and Administrative Support Workers | Iteration | 2.0% |
| Present investment information, such as product risks, fees, or fund performance statistics. | Managers, All Other | Learning | 1.7% |
| Identify, investigate, or resolve security breaches. | Managers, All Other | Feedback loop | 1.4% |
| Process and prepare documents, such as business or government forms and expense reports. | Office Clerks, General | Directive | 1.4% |
| Review financial statements, sales or activity reports, or other performance data to measure productivity or goal achievement or to identify areas needing cost reduction or program improvement. | General and Operations Managers | Directive | 1.3% |
| Analyze business operations, trends, costs, revenues, financial commitments, and obligations to project future revenues and expenses or to provide advice. | Accountants and Auditors | Iteration | 1.0% |
| Develop or implement product-marketing strategies, including advertising campaigns or sales promotions. | General and Operations Managers | Iteration | 1.0% |
Occupations behind the signal
The occupations whose AI-touched tasks contribute most to this industry's signal, by employment here.
| Occupation | Workers | Share | How they use AI |
|---|---|---|---|
| Heavy and Tractor-Trailer Truck Drivers | 32,730 | 5.7% | Directive |
| First-Line Supervisors of Construction Trades and Extraction Workers | 32,560 | 5.7% | Directive |
| General and Operations Managers | 22,210 | 3.9% | Iteration |
| Industrial Machinery Mechanics | 18,570 | 3.2% | Directive |
| Mobile Heavy Equipment Mechanics, Except Engines | 10,940 | 1.9% | Learning |
| Office Clerks, General | 8,970 | 1.6% | Feedback loop |
| Accountants and Auditors | 7,570 | 1.3% | Directive |
| First-Line Supervisors of Mechanics, Installers, and Repairers | 6,890 | 1.2% | Directive |
| Bookkeeping, Accounting, and Auditing Clerks | 6,460 | 1.1% | Directive |
| Secretaries and Administrative Assistants, Except Legal, Medical, and Executive | 6,190 | 1.1% | Directive |
| Maintenance and Repair Workers, General | 6,180 | 1.1% | Learning |
| Electricians | 6,160 | 1.1% | Feedback loop |
This rollup is only as complete as the occupation-task matches available for the industry; the coverage figure above is shown so sparse industries do not look falsely precise. AI exposure is not the same as replacement.
Skill & tool metabolism
What this industry's work actually runs on. Each figure is the share of the industry's workers in occupations that significantly rely on a skill, knowledge area, or ability (O*NET importance ≥ 3 of 5), or that use a tool category — its employment reach. This is a measure of how widespread a requirement is across the workforce, not how intensively any one worker uses it. Shares are independent and need not add to 100%.
Based on 95.6% of this industry's employment that maps to a detailed occupation with an O*NET skill profile.
Skills
| Skill | Employment reach | Workers |
|---|---|---|
| Monitoring | 87.2% | 500,340 |
| Critical Thinking | 84.5% | 484,320 |
| Speaking | 78.5% | 450,460 |
| Active Listening | 77.8% | 446,140 |
| Judgment and Decision Making | 72.1% | 413,730 |
| Operations Monitoring | 63.8% | 365,760 |
| Reading Comprehension | 63.7% | 365,300 |
| Time Management | 63.7% | 365,280 |
| Complex Problem Solving | 61.7% | 353,950 |
| Operation and Control | 58.8% | 337,460 |
| Coordination | 54.3% | 311,630 |
| Writing | 49.1% | 281,390 |
Knowledge areas
| Knowledge area | Employment reach | Workers |
|---|---|---|
| English Language | 67.2% | 385,190 |
| Mechanical | 63.6% | 364,710 |
| Customer and Personal Service | 56.6% | 324,770 |
| Mathematics | 55.9% | 320,860 |
| Administration and Management | 45.7% | 262,040 |
| Public Safety and Security | 39.4% | 225,870 |
| Production and Processing | 33.5% | 192,280 |
| Computers and Electronics | 28.8% | 165,180 |
| Education and Training | 26.8% | 153,480 |
| Engineering and Technology | 23.5% | 134,490 |
| Administrative | 21.3% | 122,320 |
| Design | 20.6% | 118,250 |
Abilities
| Abilitie | Employment reach | Workers |
|---|---|---|
| Near Vision | 95.6% | 548,330 |
| Oral Expression | 94.0% | 538,870 |
| Problem Sensitivity | 93.8% | 538,210 |
| Deductive Reasoning | 91.7% | 526,030 |
| Information Ordering | 89.6% | 513,600 |
| Oral Comprehension | 89.6% | 513,720 |
| Speech Recognition | 87.7% | 502,720 |
| Selective Attention | 81.9% | 469,820 |
| Speech Clarity | 77.1% | 441,940 |
| Inductive Reasoning | 73.8% | 423,470 |
| Category Flexibility | 70.4% | 403,780 |
| Manual Dexterity | 69.7% | 399,500 |
Tool categories
| Tool category | Employment reach | Workers |
|---|---|---|
| Spreadsheet software | 96.5% | 553,220 |
| Office suite software | 92.1% | 528,130 |
| Word processing software | 89.2% | 511,310 |
| Electronic mail software | 82.4% | 472,380 |
| Enterprise resource planning ERP software | 72.8% | 417,540 |
| Data base user interface and query software | 67.9% | 389,130 |
| Presentation software | 65.1% | 373,130 |
| Operating system software | 61.4% | 352,150 |
| Analytical or scientific software | 53.0% | 303,830 |
| Project management software | 45.8% | 262,490 |
| Inventory management software | 41.6% | 238,650 |
| Document management software | 40.4% | 231,880 |
| Industrial control software | 39.7% | 227,520 |
| Computer aided design CAD software | 35.3% | 202,430 |
| Time accounting software | 32.8% | 188,160 |
Reach = share of industry employment in occupations where the requirement is significant; it is not a per-worker usage or proficiency measure. Skill, knowledge, and ability importance is from O*NET; tool use is reported presence of a technology category.
Largest occupations
The occupations that employ the most people in this industry, with their share of the industry's workforce and national median pay for the occupation (not industry-specific pay).
Showing the top 40 of 243 occupations by employment.
Most distinctive occupations
The occupations most unusually concentrated in this industry compared with the economy as a whole. The location quotient is how many times more common an occupation is here versus its economy-wide share (a value of 5 means five times as concentrated).
For a sector this broad, the location quotient has a ceiling set by the sector's own share of national employment, so the top values tend to cluster near that limit.
Write a report on thisheadline · factoids · citation
The Mining, Quarrying, and Oil and Gas Extraction workforce sits at the 14th percentile of AI task overlap — 573,480 U.S. workers
- Weighting every occupation by its real share of Mining, Quarrying, and Oil and Gas Extraction employment, the industry's workforce ranks in the 14th percentile (Low band) for AI task overlap — overlap with what AI can attempt, not a measure of jobs at risk.Eloundou et al. + Felten AIOE, weighted by BLS OEWS
- The industry employs about 573,480 U.S. workers across 243 occupations.BLS OEWS (May 2024)
- Employment-weighted typical annual pay is about $75,083.BLS OEWS (May 2024)
- Of AI use observed across this industry's occupations, 38% looks like augmentation rather than automation — from a Claude.ai sample, not a census.Anthropic Economic Index
The Mining, Quarrying, and Oil and Gas Extraction workforce sits at the 14th percentile of AI task overlap — 573,480 U.S. workers

• Weighting every occupation by its real share of Mining, Quarrying, and Oil and Gas Extraction employment, the industry's workforce ranks in the 14th percentile (Low band) for AI task overlap — overlap with what AI can attempt, not a measure of jobs at risk. (Eloundou et al. + Felten AIOE, weighted by BLS OEWS)
• The industry employs about 573,480 U.S. workers across 243 occupations. (BLS OEWS (May 2024))
• Employment-weighted typical annual pay is about $75,083. (BLS OEWS (May 2024))
• Of AI use observed across this industry's occupations, 38% looks like augmentation rather than automation — from a Claude.ai sample, not a census. (Anthropic Economic Index)

Source: Singulariki — "Mining, Quarrying, and Oil and Gas Extraction". https://singulariki.com/industries/21
Note: AI task overlap measures what today's AI can attempt, not automation, job loss, or a forecast.
AssetsShare imageMethodology & sourcesPress & newsroomThe newsroom
Every line is built only from figures this page already shows and cites. AI task overlap means what today's AI can attempt — not automation, job loss, or a forecast.
Sources for this page
Every figure above traces to a named public dataset and the exact release below — not hand-written opinion. See the full methodology for what each measure does and does not mean.
- O*NET 30.3 U.S. Department of Labor / National Center for O*NET Development
- BLS Occupational Employment and Wage Statistics (OEWS) May 2024 U.S. Bureau of Labor Statistics
- Census NAICS 2022 U.S. Census Bureau
- Anthropic Economic Index v4 (2026-01-15) + v2 (2025-03-27) Anthropic
- “GPTs are GPTs” (Eloundou et al.) arXiv 2303.10130 OpenAI / academic
- AI Occupational Exposure (AIOE) Felten, Raj & Seamans academic
Data compiled June 3, 2026. Figures are estimates, not advice.
Cite this page
Singulariki. "Mining, Quarrying, and Oil and Gas Extraction." Singulariki: a source-backed encyclopedia of work. Built from O*NET 30.3; BLS Occupational Employment and Wage Statistics (OEWS) May 2024; Census NAICS 2022; Anthropic Economic Index v4 (2026-01-15) + v2 (2025-03-27); “GPTs are GPTs” (Eloundou et al.) arXiv 2303.10130; AI Occupational Exposure (AIOE) Felten, Raj & Seamans. Accessed June 7, 2026. https://singulariki.com/industries/21
Singulariki. (2026). Mining, Quarrying, and Oil and Gas Extraction. Singulariki: a source-backed encyclopedia of work. Retrieved June 7, 2026, from https://singulariki.com/industries/21
@misc{singulariki-21,
  title  = {Mining, Quarrying, and Oil and Gas Extraction},
  author = {{Singulariki}},
  year   = {2026},
  note   = {O*NET 30.3; BLS Occupational Employment and Wage Statistics (OEWS) May 2024; Census NAICS 2022; Anthropic Economic Index v4 (2026-01-15) + v2 (2025-03-27); “GPTs are GPTs” (Eloundou et al.) arXiv 2303.10130; AI Occupational Exposure (AIOE) Felten, Raj & Seamans. Accessed June 7, 2026},
  url    = {https://singulariki.com/industries/21}
} Citations name the underlying public dataset releases — they reflect what this page is built from, not just the URL.