Transportation and Warehousing
Sector · NAICS 48-49
A source-stamped Markdown brief of this occupation — paste it into an agent, or fetch
/industries/48-49/context.md directly.
Transportation and Warehousing is a U.S. industry in the NAICS classification. The Bureau of Labor Statistics estimates about 7,391,940 workers across 421 detailed occupations in it. A typical worker earns around $56,255 a year (Singulariki estimate, see below).
The Sector as a Whole The Transportation and Warehousing sector includes industries providing transportation of passengers and cargo, warehousing and storage for goods, scenic and sightseeing transportation, and support activities related to modes of transportation. Establishments in these industries use transportation equipment or transportation-related facilities as a productive asset. The type of equipment depends on the mode of transportation. The modes of transportation are air, rail, water, road, and pipeline. The Transportation and Warehousing sector distinguishes three basic types of activities: subsectors for each mode of transportation, a subsector for warehousing and storage, and a subsector for establishments providing support activities for transportation. In addition, there are subsectors for establishments that provide passenger transportation for scenic and sightseeing purposes, postal services, and courier services. A separate subsector for support activities is established in the sector because, first, support activities for transportation are inherently multimodal, such as freight transportation arrangement, or have multimodal aspects. Secondly, there are production process similarities among the support activity industries. One of the support activities identified in the Support Activities for Transportation subsector is the routine repair and maintenance of transportation equipment (e.g., aircraft at an airport, railroad rolling stock at a railroad terminal, or ships at a harbor or port facility). Such establishments do not perform complete overhauling or rebuilding of transportation equipment (i.e., periodic restoration of transportation equipment to original design specifications) or transportation equipment conversion (i.e., major modification to systems). An establishment that primarily performs factory (or shipyard) overhauls, rebuilding, or conversions of aircraft, railroad rolling stock, or ships is classified in Subsector 336, Transportation Equipment Manufacturing, according to the type of equipment. Many of the establishments in this sector often operate on networks, with physical facilities, labor forces, and equipment spread over an extensive geographic area. Warehousing establishments in this sector are distinguished from merchant wholesaling in that the warehouse establishments do not sell the goods. Excluded from this sector are establishments primarily engaged in providing travel agent, travel arrangement, and reservation services that support transportation establishments, hotels, other businesses, and government agencies. These establishments are classified in Sector 56, Administrative and Support and Waste Management and Remediation Services. Establishments primarily engaged in providing rental and leasing of transportation equipment without operator are classified in Subsector 532, Rental and Leasing Services. Establishments primarily engaged in providing medical care with transportation are classified in Sector 62, Health Care and Social Assistance.
Employment is national May 2024 OEWS. "Typical pay" is Singulariki's own figure — the employment-weighted average of each occupation's national median wage — a rough center of the industry, not an official BLS number.
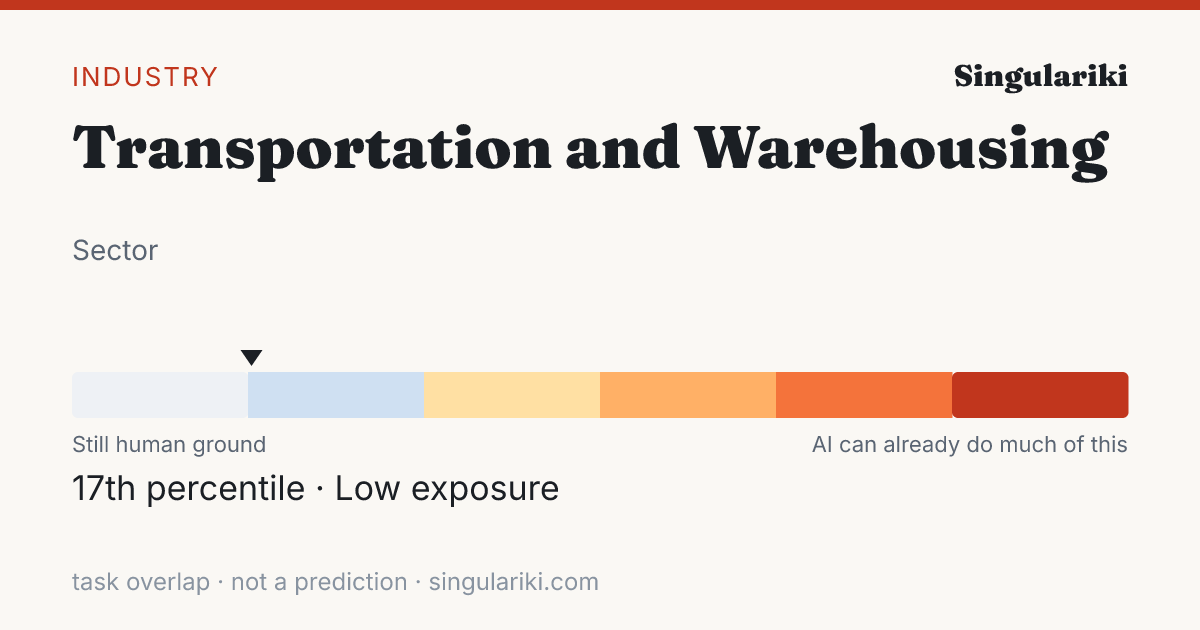
How exposed this industry is to AI
Weighting every occupation in this industry by its employment and its unified AI-exposure index (the OpenAI "GPTs are GPTs" human-rated task overlap folded with the Felten/Raj/Seamans AIOE index), this industry sits in the Low band — 17th percentile across all industries.
Exposure measures how much of the work overlaps with what today's AI can do, not a prediction of automation; high-exposure industries are where AI is most likely to reshape tasks. Employment-weighted across 368 occupations that carry an exposure score. Compare every industry on the AI exposure hub.
How AI is actually used in this industry
Among measured Claude.ai (Free and Pro) conversations mapped to O*NET task statements (Anthropic Economic Index, 2026-01-15), these patterns are most associated with the occupations in this industry, weighted by its employment mix. They are shares of observed AI conversations — not of worker time, revenue, or what could be automated — and reflect one AI assistant's consumer sample, not all AI.
| Signal coverage | 45.1% of employment · 203/397 occupations have AEI task data |
| Augmentation vs. automation | 36.7% working with AI · 34.4% handed to AI |
| Most common pattern | Directive · AI does it; you give the instruction |
| Typical AI autonomy | 3.5 / 5 · higher = AI acts more independently |
Tasks driving the signal
The task families that account for the most AI activity across this industry's occupations (employment × observed usage), each attributed to the occupation it comes from.
| Task | Occupation | How | Share of signal |
|---|---|---|---|
| Troubleshoot problems involving office equipment, such as computer hardware and software. | Office Clerks, General | Feedback loop | 35.9% |
| Participate in the work of subordinates to facilitate productivity or to overcome difficult aspects of work. | First-Line Supervisors of Office and Administrative Support Workers | Iteration | 6.4% |
| Use computers for various applications, such as database management or word processing. | Secretaries and Administrative Assistants, Except Legal, Medical, and Executive | Directive | 3.6% |
| Conduct searches to find needed information, using such sources as the Internet. | Secretaries and Administrative Assistants, Except Legal, Medical, and Executive | Directive | 3.3% |
| Answer inquiries regarding information such as schedules, accommodations, procedures, and policies. | Reservation and Transportation Ticket Agents and Travel Clerks | Directive | 3.0% |
| Provide customers with travel suggestions and information sources, such as guides, directories, brochures, and maps. | Reservation and Transportation Ticket Agents and Travel Clerks | Directive | 2.9% |
| Develop or maintain internal or external company Web sites. | Secretaries and Administrative Assistants, Except Legal, Medical, and Executive | Directive | 2.5% |
| Read and interpret maps to determine vehicle routes. | Heavy and Tractor-Trailer Truck Drivers | Directive | 1.8% |
| Process and prepare documents, such as business or government forms and expense reports. | Office Clerks, General | Directive | 1.4% |
| Provide employees with guidance in handling difficult or complex problems or in resolving escalated complaints or disputes. | First-Line Supervisors of Office and Administrative Support Workers | Iteration | 1.3% |
| Keep records of customer interactions or transactions, recording details of inquiries, complaints, or comments, as well as actions taken. | Customer Service Representatives | Directive | 1.1% |
| Confer with customers by telephone or in person to provide information about products or services, take or enter orders, cancel accounts, or obtain details of complaints. | Customer Service Representatives | Directive | 1.0% |
Occupations behind the signal
The occupations whose AI-touched tasks contribute most to this industry's signal, by employment here.
| Occupation | Workers | Share | How they use AI |
|---|---|---|---|
| Heavy and Tractor-Trailer Truck Drivers | 1,183,530 | 16.0% | Directive |
| Postal Service Mail Carriers | 336,040 | 4.5% | — |
| Shipping, Receiving, and Inventory Clerks | 137,140 | 1.9% | Iteration |
| Flight Attendants | 128,630 | 1.7% | Learning |
| General and Operations Managers | 119,760 | 1.6% | Iteration |
| Customer Service Representatives | 107,050 | 1.5% | Directive |
| Reservation and Transportation Ticket Agents and Travel Clerks | 97,650 | 1.3% | Directive |
| First-Line Supervisors of Office and Administrative Support Workers | 95,390 | 1.3% | Iteration |
| Dispatchers, Except Police, Fire, and Ambulance | 90,490 | 1.2% | Learning |
| Cargo and Freight Agents | 89,080 | 1.2% | Directive |
| Office Clerks, General | 85,930 | 1.2% | Feedback loop |
| Transportation, Storage, and Distribution Managers | 68,620 | 0.9% | Iteration |
This rollup is only as complete as the occupation-task matches available for the industry; the coverage figure above is shown so sparse industries do not look falsely precise. AI exposure is not the same as replacement.
Skill & tool metabolism
What this industry's work actually runs on. Each figure is the share of the industry's workers in occupations that significantly rely on a skill, knowledge area, or ability (O*NET importance ≥ 3 of 5), or that use a tool category — its employment reach. This is a measure of how widespread a requirement is across the workforce, not how intensively any one worker uses it. Shares are independent and need not add to 100%.
Based on 94.7% of this industry's employment that maps to a detailed occupation with an O*NET skill profile.
Skills
| Skill | Employment reach | Workers |
|---|---|---|
| Active Listening | 69.8% | 5,161,840 |
| Speaking | 67.5% | 4,992,430 |
| Critical Thinking | 67.0% | 4,950,350 |
| Reading Comprehension | 63.5% | 4,693,810 |
| Monitoring | 62.0% | 4,581,020 |
| Time Management | 61.5% | 4,545,640 |
| Operation and Control | 40.1% | 2,966,150 |
| Operations Monitoring | 36.7% | 2,709,170 |
| Coordination | 33.2% | 2,454,870 |
| Social Perceptiveness | 32.2% | 2,383,620 |
| Troubleshooting | 29.3% | 2,168,660 |
| Writing | 26.3% | 1,946,110 |
Knowledge areas
| Knowledge area | Employment reach | Workers |
|---|---|---|
| English Language | 85.7% | 6,338,000 |
| Customer and Personal Service | 78.8% | 5,822,940 |
| Public Safety and Security | 55.8% | 4,122,420 |
| Transportation | 43.3% | 3,203,880 |
| Administration and Management | 36.3% | 2,683,520 |
| Law and Government | 27.4% | 2,024,160 |
| Mathematics | 27.3% | 2,017,350 |
| Production and Processing | 26.9% | 1,991,410 |
| Computers and Electronics | 24.4% | 1,804,310 |
| Education and Training | 24.4% | 1,801,890 |
| Administrative | 18.5% | 1,364,530 |
| Mechanical | 12.4% | 916,980 |
Abilities
| Abilitie | Employment reach | Workers |
|---|---|---|
| Near Vision | 94.4% | 6,975,650 |
| Oral Comprehension | 94.0% | 6,948,230 |
| Information Ordering | 91.8% | 6,787,650 |
| Oral Expression | 88.1% | 6,512,880 |
| Problem Sensitivity | 75.3% | 5,567,520 |
| Speech Recognition | 73.8% | 5,457,120 |
| Speech Clarity | 71.2% | 5,261,160 |
| Selective Attention | 71.1% | 5,255,530 |
| Deductive Reasoning | 67.9% | 5,019,100 |
| Written Comprehension | 67.5% | 4,991,520 |
| Category Flexibility | 65.4% | 4,833,230 |
| Manual Dexterity | 64.4% | 4,763,260 |
Tool categories
| Tool category | Employment reach | Workers |
|---|---|---|
| Office suite software | 91.2% | 6,739,310 |
| Spreadsheet software | 86.7% | 6,408,010 |
| Word processing software | 81.9% | 6,051,000 |
| Electronic mail software | 81.1% | 5,997,010 |
| Data base user interface and query software | 78.8% | 5,827,300 |
| Operating system software | 74.7% | 5,521,610 |
| Enterprise resource planning ERP software | 73.9% | 5,463,300 |
| Inventory management software | 63.0% | 4,658,110 |
| Materials requirements planning logistics and supply chain software | 51.9% | 3,836,170 |
| Internet browser software | 44.4% | 3,281,870 |
| Desktop communications software | 36.3% | 2,679,750 |
| Calendar and scheduling software | 35.1% | 2,596,500 |
| Time accounting software | 34.8% | 2,572,820 |
| Analytical or scientific software | 32.7% | 2,416,780 |
| Computer aided design CAD software | 29.7% | 2,197,510 |
Reach = share of industry employment in occupations where the requirement is significant; it is not a per-worker usage or proficiency measure. Skill, knowledge, and ability importance is from O*NET; tool use is reported presence of a technology category.
Largest occupations
The occupations that employ the most people in this industry, with their share of the industry's workforce and national median pay for the occupation (not industry-specific pay).
Showing the top 40 of 421 occupations by employment.
Most distinctive occupations
The occupations most unusually concentrated in this industry compared with the economy as a whole. The location quotient is how many times more common an occupation is here versus its economy-wide share (a value of 5 means five times as concentrated).
For a sector this broad, the location quotient has a ceiling set by the sector's own share of national employment, so the top values tend to cluster near that limit.
Write a report on thisheadline · factoids · citation
The Transportation and Warehousing workforce sits at the 17th percentile of AI task overlap — 7,391,940 U.S. workers
- Weighting every occupation by its real share of Transportation and Warehousing employment, the industry's workforce ranks in the 17th percentile (Low band) for AI task overlap — overlap with what AI can attempt, not a measure of jobs at risk.Eloundou et al. + Felten AIOE, weighted by BLS OEWS
- The industry employs about 7,391,940 U.S. workers across 421 occupations.BLS OEWS (May 2024)
- Employment-weighted typical annual pay is about $56,255.BLS OEWS (May 2024)
- Of AI use observed across this industry's occupations, 37% looks like augmentation rather than automation — from a Claude.ai sample, not a census.Anthropic Economic Index
The Transportation and Warehousing workforce sits at the 17th percentile of AI task overlap — 7,391,940 U.S. workers

• Weighting every occupation by its real share of Transportation and Warehousing employment, the industry's workforce ranks in the 17th percentile (Low band) for AI task overlap — overlap with what AI can attempt, not a measure of jobs at risk. (Eloundou et al. + Felten AIOE, weighted by BLS OEWS)
• The industry employs about 7,391,940 U.S. workers across 421 occupations. (BLS OEWS (May 2024))
• Employment-weighted typical annual pay is about $56,255. (BLS OEWS (May 2024))
• Of AI use observed across this industry's occupations, 37% looks like augmentation rather than automation — from a Claude.ai sample, not a census. (Anthropic Economic Index)

Source: Singulariki — "Transportation and Warehousing". https://singulariki.com/industries/48-49
Note: AI task overlap measures what today's AI can attempt, not automation, job loss, or a forecast.
AssetsShare imageMethodology & sourcesPress & newsroomThe newsroom
Every line is built only from figures this page already shows and cites. AI task overlap means what today's AI can attempt — not automation, job loss, or a forecast.
Sources for this page
Every figure above traces to a named public dataset and the exact release below — not hand-written opinion. See the full methodology for what each measure does and does not mean.
- O*NET 30.3 U.S. Department of Labor / National Center for O*NET Development
- BLS Occupational Employment and Wage Statistics (OEWS) May 2024 U.S. Bureau of Labor Statistics
- Census NAICS 2022 U.S. Census Bureau
- Anthropic Economic Index v4 (2026-01-15) + v2 (2025-03-27) Anthropic
- “GPTs are GPTs” (Eloundou et al.) arXiv 2303.10130 OpenAI / academic
- AI Occupational Exposure (AIOE) Felten, Raj & Seamans academic
Data compiled June 3, 2026. Figures are estimates, not advice.
Cite this page
Singulariki. "Transportation and Warehousing." Singulariki: a source-backed encyclopedia of work. Built from O*NET 30.3; BLS Occupational Employment and Wage Statistics (OEWS) May 2024; Census NAICS 2022; Anthropic Economic Index v4 (2026-01-15) + v2 (2025-03-27); “GPTs are GPTs” (Eloundou et al.) arXiv 2303.10130; AI Occupational Exposure (AIOE) Felten, Raj & Seamans. Accessed June 7, 2026. https://singulariki.com/industries/48-49
Singulariki. (2026). Transportation and Warehousing. Singulariki: a source-backed encyclopedia of work. Retrieved June 7, 2026, from https://singulariki.com/industries/48-49
@misc{singulariki-48-49,
  title  = {Transportation and Warehousing},
  author = {{Singulariki}},
  year   = {2026},
  note   = {O*NET 30.3; BLS Occupational Employment and Wage Statistics (OEWS) May 2024; Census NAICS 2022; Anthropic Economic Index v4 (2026-01-15) + v2 (2025-03-27); “GPTs are GPTs” (Eloundou et al.) arXiv 2303.10130; AI Occupational Exposure (AIOE) Felten, Raj & Seamans. Accessed June 7, 2026},
  url    = {https://singulariki.com/industries/48-49}
} Citations name the underlying public dataset releases — they reflect what this page is built from, not just the URL.