Wind Electric Power Generation
National industry · NAICS 221115
A source-stamped Markdown brief of this occupation — paste it into an agent, or fetch
/industries/221115/context.md directly.
Wind Electric Power Generation is a U.S. industry in the NAICS classification. The Bureau of Labor Statistics estimates about 9,930 workers across 47 detailed occupations in it. A typical worker earns around $92,333 a year (Singulariki estimate, see below).
This U.S. industry comprises establishments primarily engaged in operating wind electric power generation facilities. These facilities use wind power to drive a turbine and produce electric energy. The electric energy produced in these establishments is provided to electric power transmission systems or to electric power distribution systems.
Employment is national May 2024 OEWS. "Typical pay" is Singulariki's own figure — the employment-weighted average of each occupation's national median wage — a rough center of the industry, not an official BLS number.
How exposed this industry is to AI
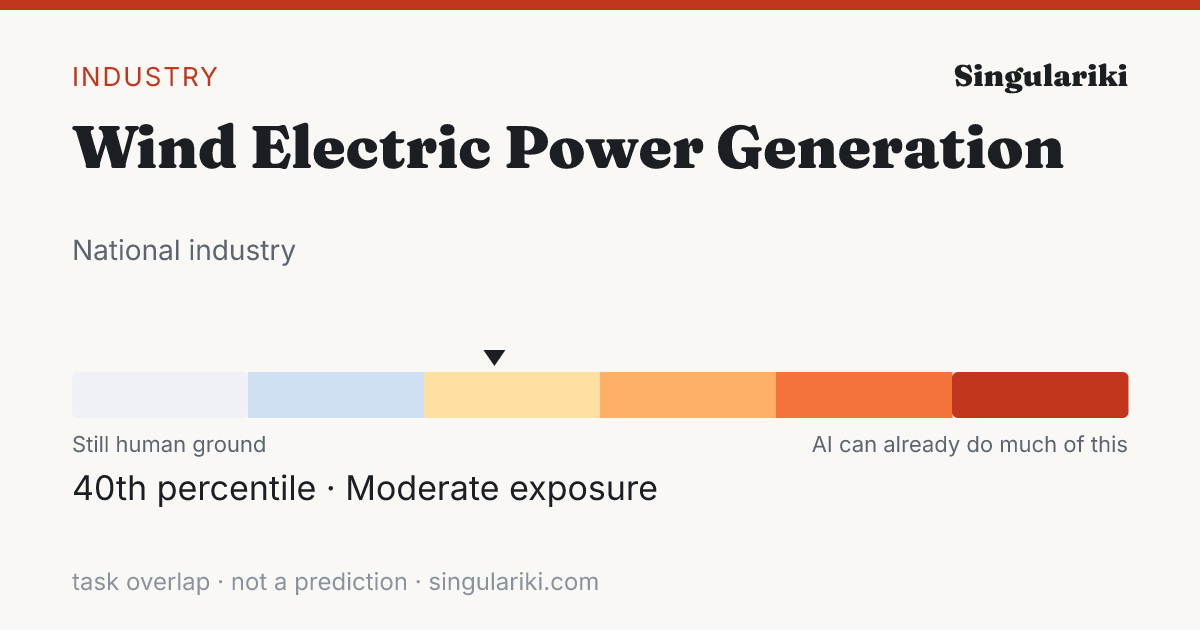
Weighting every occupation in this industry by its employment and its unified AI-exposure index (the OpenAI "GPTs are GPTs" human-rated task overlap folded with the Felten/Raj/Seamans AIOE index), this industry sits in the Moderate band — 40th percentile across all industries.
Exposure measures how much of the work overlaps with what today's AI can do, not a prediction of automation; high-exposure industries are where AI is most likely to reshape tasks. Employment-weighted across 46 occupations that carry an exposure score. Compare every industry on the AI exposure hub.
How AI is actually used in this industry
Among measured Claude.ai (Free and Pro) conversations mapped to O*NET task statements (Anthropic Economic Index, 2026-01-15), these patterns are most associated with the occupations in this industry, weighted by its employment mix. They are shares of observed AI conversations — not of worker time, revenue, or what could be automated — and reflect one AI assistant's consumer sample, not all AI.
| Signal coverage | 46.7% of employment · 39/47 occupations have AEI task data |
| Augmentation vs. automation | 40.8% working with AI · 37.8% handed to AI |
| Most common pattern | Directive · AI does it; you give the instruction |
| Typical AI autonomy | 3.6 / 5 · higher = AI acts more independently |
Tasks driving the signal
The task families that account for the most AI activity across this industry's occupations (employment × observed usage), each attributed to the occupation it comes from.
| Task | Occupation | How | Share of signal |
|---|---|---|---|
| Troubleshoot problems involving office equipment, such as computer hardware and software. | Office Clerks, General | Feedback loop | 12.7% |
| Present investment information, such as product risks, fees, or fund performance statistics. | Managers, All Other | Learning | 7.6% |
| Identify, investigate, or resolve security breaches. | Managers, All Other | Feedback loop | 6.0% |
| Use computers for various applications, such as database management or word processing. | Secretaries and Administrative Assistants, Except Legal, Medical, and Executive | Directive | 3.2% |
| Conduct searches to find needed information, using such sources as the Internet. | Secretaries and Administrative Assistants, Except Legal, Medical, and Executive | Directive | 3.0% |
| Compose descriptions of merchandise for posting to online storefront, auction sites, or other shopping Web sites. | Business Operations Specialists, All Other | Directive | 2.4% |
| Develop or maintain internal or external company Web sites. | Secretaries and Administrative Assistants, Except Legal, Medical, and Executive | Directive | 2.2% |
| Present and explain proposals, reports, or findings to clients. | Architectural and Engineering Managers | Iteration | 1.5% |
| Compose images of products, using video or still cameras, lighting equipment, props, or photo or video editing software. | Business Operations Specialists, All Other | Iteration | 1.5% |
| Develop or analyze information to assess the current or future financial status of firms. | Financial Managers | Directive | 1.3% |
| Review financial statements, sales or activity reports, or other performance data to measure productivity or goal achievement or to identify areas needing cost reduction or program improvement. | General and Operations Managers | Directive | 1.2% |
| Monitor financial or operational performance of individual investments to ensure portfolios meet risk goals. | Managers, All Other | Directive | 1.2% |
Occupations behind the signal
The occupations whose AI-touched tasks contribute most to this industry's signal, by employment here.
| Occupation | Workers | Share | How they use AI |
|---|---|---|---|
| General and Operations Managers | 490 | 4.9% | Iteration |
| First-Line Supervisors of Mechanics, Installers, and Repairers | 430 | 4.3% | Directive |
| Power Plant Operators | 410 | 4.1% | Directive |
| Managers, All Other | 370 | 3.7% | Directive |
| Business Operations Specialists, All Other | 230 | 2.3% | Directive |
| Electrical Engineers | 200 | 2.0% | Iteration |
| Solar Photovoltaic Installers | 200 | 2.0% | Learning |
| Architectural and Engineering Managers | 170 | 1.7% | Iteration |
| Accountants and Auditors | 160 | 1.6% | Directive |
| Construction Managers | 130 | 1.3% | Iteration |
| Electrical and Electronic Engineering Technologists and Technicians | 120 | 1.2% | Learning |
| Financial Managers | 110 | 1.1% | Directive |
This rollup is only as complete as the occupation-task matches available for the industry; the coverage figure above is shown so sparse industries do not look falsely precise. AI exposure is not the same as replacement.
Skill & tool metabolism
What this industry's work actually runs on. Each figure is the share of the industry's workers in occupations that significantly rely on a skill, knowledge area, or ability (O*NET importance ≥ 3 of 5), or that use a tool category — its employment reach. This is a measure of how widespread a requirement is across the workforce, not how intensively any one worker uses it. Shares are independent and need not add to 100%.
Based on 95.2% of this industry's employment that maps to a detailed occupation with an O*NET skill profile.
Skills
| Skill | Employment reach | Workers |
|---|---|---|
| Active Listening | 95.2% | 9,450 |
| Critical Thinking | 95.2% | 9,450 |
| Monitoring | 94.4% | 9,370 |
| Reading Comprehension | 94.4% | 9,370 |
| Speaking | 93.2% | 9,250 |
| Coordination | 93.1% | 9,240 |
| Judgment and Decision Making | 92.7% | 9,210 |
| Complex Problem Solving | 92.2% | 9,160 |
| Time Management | 89.8% | 8,920 |
| Active Learning | 86.5% | 8,590 |
| Systems Analysis | 81.1% | 8,050 |
| Systems Evaluation | 79.2% | 7,860 |
Knowledge areas
| Knowledge area | Employment reach | Workers |
|---|---|---|
| English Language | 95.2% | 9,450 |
| Administration and Management | 87.5% | 8,690 |
| Mathematics | 85.6% | 8,500 |
| Computers and Electronics | 82.9% | 8,230 |
| Mechanical | 69.3% | 6,880 |
| Engineering and Technology | 66.5% | 6,600 |
| Public Safety and Security | 66.4% | 6,590 |
| Education and Training | 64.2% | 6,380 |
| Physics | 59.5% | 5,910 |
| Building and Construction | 52.1% | 5,170 |
| Customer and Personal Service | 40.2% | 3,990 |
| Administrative | 25.8% | 2,560 |
Abilities
| Abilitie | Employment reach | Workers |
|---|---|---|
| Deductive Reasoning | 95.2% | 9,450 |
| Information Ordering | 95.2% | 9,450 |
| Near Vision | 95.2% | 9,450 |
| Oral Comprehension | 95.2% | 9,450 |
| Oral Expression | 95.2% | 9,450 |
| Problem Sensitivity | 95.2% | 9,450 |
| Inductive Reasoning | 94.7% | 9,400 |
| Written Comprehension | 93.2% | 9,250 |
| Speech Recognition | 92.4% | 9,180 |
| Written Expression | 91.8% | 9,120 |
| Speech Clarity | 91.6% | 9,100 |
| Category Flexibility | 90.4% | 8,980 |
Tool categories
| Tool category | Employment reach | Workers |
|---|---|---|
| Electronic mail software | 99.0% | 9,830 |
| Office suite software | 99.0% | 9,830 |
| Spreadsheet software | 99.0% | 9,830 |
| Word processing software | 99.0% | 9,830 |
| Enterprise resource planning ERP software | 96.3% | 9,560 |
| Presentation software | 96.3% | 9,560 |
| Data base user interface and query software | 96.0% | 9,530 |
| Project management software | 92.1% | 9,150 |
| Analytical or scientific software | 88.6% | 8,800 |
| Internet browser software | 88.5% | 8,790 |
| Industrial control software | 77.5% | 7,700 |
| Facilities management software | 67.6% | 6,710 |
| Document management software | 42.1% | 4,180 |
| Operating system software | 40.0% | 3,970 |
| Development environment software | 35.0% | 3,480 |
Reach = share of industry employment in occupations where the requirement is significant; it is not a per-worker usage or proficiency measure. Skill, knowledge, and ability importance is from O*NET; tool use is reported presence of a technology category.
Largest occupations
The occupations that employ the most people in this industry, with their share of the industry's workforce and national median pay for the occupation (not industry-specific pay).
Showing the top 40 of 47 occupations by employment.
Most distinctive occupations
The occupations most unusually concentrated in this industry compared with the economy as a whole. The location quotient is how many times more common an occupation is here versus its economy-wide share (a value of 5 means five times as concentrated).
| Occupation | Concentration | Workers |
|---|---|---|
| Wind Turbine Service Technicians | 6393.6× | 4,620 |
| Power Plant Operators | 207.23× | 410 |
| Solar Photovoltaic Installers | 109.81× | 200 |
| Electrical and Electronic Engineering Technologists and Technicians | 20.1× | 120 |
| Electrical Engineers | 16.45× | 200 |
| Architectural and Engineering Managers | 12.55× | 170 |
| Engineers, All Other | 11.33× | 110 |
| First-Line Supervisors of Mechanics, Installers, and Repairers | 11.12× | 430 |
| Managers, All Other | 9.11× | 370 |
| Construction Managers | 5.79× | 130 |
| Project Management Specialists | 4.17× | 270 |
| Training and Development Specialists | 3.91× | 110 |
| Buyers and Purchasing Agents | 3.19× | 100 |
| Business Operations Specialists, All Other | 3.17× | 230 |
| General and Operations Managers | 2.12× | 490 |
| Financial Managers | 2.09× | 110 |
| Accountants and Auditors | 1.72× | 160 |
Write a report on thisheadline · factoids · citation
The Wind Electric Power Generation workforce sits at the 40th percentile of AI task overlap — 9,930 U.S. workers
- Weighting every occupation by its real share of Wind Electric Power Generation employment, the industry's workforce ranks in the 40th percentile (Moderate band) for AI task overlap — overlap with what AI can attempt, not a measure of jobs at risk.Eloundou et al. + Felten AIOE, weighted by BLS OEWS
- The industry employs about 9,930 U.S. workers across 47 occupations.BLS OEWS (May 2024)
- Employment-weighted typical annual pay is about $92,333.BLS OEWS (May 2024)
- Of AI use observed across this industry's occupations, 41% looks like augmentation rather than automation — from a Claude.ai sample, not a census.Anthropic Economic Index
The Wind Electric Power Generation workforce sits at the 40th percentile of AI task overlap — 9,930 U.S. workers

• Weighting every occupation by its real share of Wind Electric Power Generation employment, the industry's workforce ranks in the 40th percentile (Moderate band) for AI task overlap — overlap with what AI can attempt, not a measure of jobs at risk. (Eloundou et al. + Felten AIOE, weighted by BLS OEWS)
• The industry employs about 9,930 U.S. workers across 47 occupations. (BLS OEWS (May 2024))
• Employment-weighted typical annual pay is about $92,333. (BLS OEWS (May 2024))
• Of AI use observed across this industry's occupations, 41% looks like augmentation rather than automation — from a Claude.ai sample, not a census. (Anthropic Economic Index)

Source: Singulariki — "Wind Electric Power Generation". https://singulariki.com/industries/221115
Note: AI task overlap measures what today's AI can attempt, not automation, job loss, or a forecast.
AssetsShare imageMethodology & sourcesPress & newsroomThe newsroom
Every line is built only from figures this page already shows and cites. AI task overlap means what today's AI can attempt — not automation, job loss, or a forecast.
Sources for this page
Every figure above traces to a named public dataset and the exact release below — not hand-written opinion. See the full methodology for what each measure does and does not mean.
- O*NET 30.3 U.S. Department of Labor / National Center for O*NET Development
- BLS Occupational Employment and Wage Statistics (OEWS) May 2024 U.S. Bureau of Labor Statistics
- Census NAICS 2022 U.S. Census Bureau
- Anthropic Economic Index v4 (2026-01-15) + v2 (2025-03-27) Anthropic
- “GPTs are GPTs” (Eloundou et al.) arXiv 2303.10130 OpenAI / academic
- AI Occupational Exposure (AIOE) Felten, Raj & Seamans academic
Data compiled June 3, 2026. Figures are estimates, not advice.
Cite this page
Singulariki. "Wind Electric Power Generation." Singulariki: a source-backed encyclopedia of work. Built from O*NET 30.3; BLS Occupational Employment and Wage Statistics (OEWS) May 2024; Census NAICS 2022; Anthropic Economic Index v4 (2026-01-15) + v2 (2025-03-27); “GPTs are GPTs” (Eloundou et al.) arXiv 2303.10130; AI Occupational Exposure (AIOE) Felten, Raj & Seamans. Accessed June 7, 2026. https://singulariki.com/industries/221115
Singulariki. (2026). Wind Electric Power Generation. Singulariki: a source-backed encyclopedia of work. Retrieved June 7, 2026, from https://singulariki.com/industries/221115
@misc{singulariki-221115,
  title  = {Wind Electric Power Generation},
  author = {{Singulariki}},
  year   = {2026},
  note   = {O*NET 30.3; BLS Occupational Employment and Wage Statistics (OEWS) May 2024; Census NAICS 2022; Anthropic Economic Index v4 (2026-01-15) + v2 (2025-03-27); “GPTs are GPTs” (Eloundou et al.) arXiv 2303.10130; AI Occupational Exposure (AIOE) Felten, Raj & Seamans. Accessed June 7, 2026},
  url    = {https://singulariki.com/industries/221115}
} Citations name the underlying public dataset releases — they reflect what this page is built from, not just the URL.