Retail Trade
Sector · NAICS 44-45
A source-stamped Markdown brief of this occupation — paste it into an agent, or fetch
/industries/44-45/context.md directly.
Retail Trade is a U.S. industry in the NAICS classification. The Bureau of Labor Statistics estimates about 15,593,500 workers across 433 detailed occupations in it. A typical worker earns around $40,823 a year (Singulariki estimate, see below).
The Sector as a Whole The Retail Trade sector comprises establishments primarily engaged in retailing merchandise, generally without transformation, and rendering services incidental to the sale of merchandise. The retailing process is the final step in the distribution of merchandise; retailers are, therefore, organized to sell merchandise in small quantities to the general public. Retail stores are fixed point-of-sale locations, located and designed to attract a high volume of walk-in customers. In general, retail stores have extensive displays of merchandise and use mass-media advertising to attract customers. Retailers often reach customers and market merchandise with methods other than, or in addition to, physical stores, such as Internet websites, the broadcasting of "infomercials," the broadcasting and publishing of direct-response advertising, the publishing of paper and electronic catalogs, door-to-door solicitation, in-home demonstration, selling from portable stalls (street vendors, except food), and distribution through vending machines. Establishments engaged in the direct sale and home delivery of products, such as home heating oil dealers and home delivery newspaper routes, are included here. Retail establishments typically sell merchandise to the general public for personal or household consumption, but some also serve business and institutional clients. These include office supply retailers, computer and software retailers, building materials dealers, plumbing supply retailers, and electrical supply retailers. In addition to retailing merchandise, some retailers are also engaged in the provision of after-sales services, such as repair and installation. For example, new automobile dealers, electronics and appliance retailers, and musical instrument and supplies retailers often provide repair services. As a general rule, establishments engaged in retailing merchandise and providing after-sales services are classified in this sector. Retail trade establishments are grouped into industries and industry groups typically based on one or more of the following criteria: (a) The merchandise line or lines carried; for example, specialty retailers are distinguished from general-line retailers. (b) The usual trade designation of the establishments. This criterion applies in cases where a retailer is well recognized by the industry and the public, but difficult to define strictly in terms of merchandise lines carried; for example, pharmacies and department stores. (c) Human resource requirements in terms of expertise; for example, the staff of an automobile dealer requires knowledge in financing, registering, and licensing issues that are not necessary in other retail industries. The buying of goods for resale is a characteristic of retail trade establishments that particularly distinguishes them from establishments in the agriculture, manufacturing, and construction industries. For example, farms that sell their products at or from the point of production are not classified in retail, but rather in agriculture. Similarly, establishments that both manufacture and sell their products to the general public are not classified in retail, but rather in manufacturing. However, establishments that engage in processing activities incidental to retailing are classified in retail. This includes optical goods retailers that grind lenses, and meat and seafood retailers that process carcasses into cuts. Wholesalers also engage in the buying of goods for resale, but they are not usually organized to serve the general public. They typically operate from a warehouse or office, and neither the design nor the location of these premises is intended to solicit a high volume of walk-in traffic. Wholesalers supply institutional, industrial, wholesale, and retail clients; their operations are, therefore, generally organized to purchase, sell, and deliver merchandise in larger quantities. However, dealers of durable nonconsumer goods, such as farm machinery and heavy-duty trucks, are included in wholesale trade even if they often sell these products in single units.
Employment is national May 2024 OEWS. "Typical pay" is Singulariki's own figure — the employment-weighted average of each occupation's national median wage — a rough center of the industry, not an official BLS number.
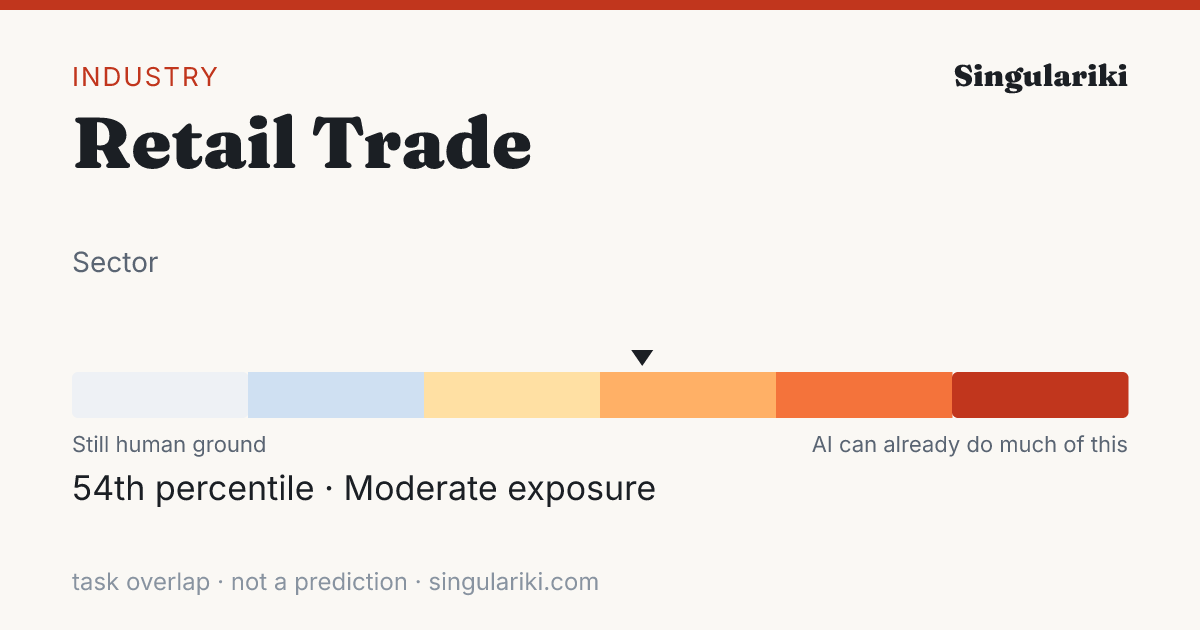
How exposed this industry is to AI
Weighting every occupation in this industry by its employment and its unified AI-exposure index (the OpenAI "GPTs are GPTs" human-rated task overlap folded with the Felten/Raj/Seamans AIOE index), this industry sits in the Moderate band — 54th percentile across all industries.
Exposure measures how much of the work overlaps with what today's AI can do, not a prediction of automation; high-exposure industries are where AI is most likely to reshape tasks. Employment-weighted across 362 occupations that carry an exposure score. Compare every industry on the AI exposure hub.
How AI is actually used in this industry
Among measured Claude.ai (Free and Pro) conversations mapped to O*NET task statements (Anthropic Economic Index, 2026-01-15), these patterns are most associated with the occupations in this industry, weighted by its employment mix. They are shares of observed AI conversations — not of worker time, revenue, or what could be automated — and reflect one AI assistant's consumer sample, not all AI.
| Signal coverage | 73.7% of employment · 211/394 occupations have AEI task data |
| Augmentation vs. automation | 39.5% working with AI · 30.9% handed to AI |
| Most common pattern | Directive · AI does it; you give the instruction |
| Typical AI autonomy | 3.5 / 5 · higher = AI acts more independently |
Tasks driving the signal
The task families that account for the most AI activity across this industry's occupations (employment × observed usage), each attributed to the occupation it comes from.
| Task | Occupation | How | Share of signal |
|---|---|---|---|
| Answer customers' questions, and provide information on procedures or policies. | Cashiers | Directive | 42.7% |
| Recommend, select, and help locate or obtain merchandise based on customer needs and desires. | Retail Salespersons | Iteration | 11.7% |
| Greet customers and ascertain what each customer wants or needs. | Retail Salespersons | none | 11.3% |
| Assist customers by providing information and resolving their complaints. | Cashiers | Iteration | 5.9% |
| Troubleshoot problems involving office equipment, such as computer hardware and software. | Office Clerks, General | Feedback loop | 5.5% |
| Describe merchandise and explain use, operation, and care of merchandise to customers. | Retail Salespersons | Learning | 4.0% |
| Greet customers entering establishments. | Cashiers | none | 2.0% |
| Answer questions regarding the store and its merchandise. | Retail Salespersons | Directive | 1.9% |
| Provide information and advice regarding drug interactions, side effects, dosage, and proper medication storage. | Pharmacists | Learning | 0.9% |
| Receive payment by cash, check, credit cards, vouchers, or automatic debits. | Cashiers | Learning | 0.8% |
| Provide customer service by greeting and assisting customers and responding to customer inquiries and complaints. | First-Line Supervisors of Retail Sales Workers | Directive | 0.8% |
| Compute and record totals of transactions. | Cashiers | Directive | 0.7% |
Occupations behind the signal
The occupations whose AI-touched tasks contribute most to this industry's signal, by employment here.
| Occupation | Workers | Share | How they use AI |
|---|---|---|---|
| Retail Salespersons | 3,445,820 | 22.1% | none |
| Cashiers | 2,619,890 | 16.8% | Directive |
| First-Line Supervisors of Retail Sales Workers | 984,680 | 6.3% | Iteration |
| Customer Service Representatives | 472,080 | 3.0% | Directive |
| General and Operations Managers | 452,460 | 2.9% | Iteration |
| Automotive Service Technicians and Mechanics | 349,330 | 2.2% | Learning |
| Pharmacy Technicians | 345,940 | 2.2% | none |
| Food Preparation Workers | 233,660 | 1.5% | Learning |
| Parts Salespersons | 196,260 | 1.3% | Learning |
| Shipping, Receiving, and Inventory Clerks | 185,670 | 1.2% | Iteration |
| Pharmacists | 171,400 | 1.1% | Learning |
| Office Clerks, General | 156,950 | 1.0% | Feedback loop |
This rollup is only as complete as the occupation-task matches available for the industry; the coverage figure above is shown so sparse industries do not look falsely precise. AI exposure is not the same as replacement.
Skill & tool metabolism
What this industry's work actually runs on. Each figure is the share of the industry's workers in occupations that significantly rely on a skill, knowledge area, or ability (O*NET importance ≥ 3 of 5), or that use a tool category — its employment reach. This is a measure of how widespread a requirement is across the workforce, not how intensively any one worker uses it. Shares are independent and need not add to 100%.
Based on 97.5% of this industry's employment that maps to a detailed occupation with an O*NET skill profile.
Skills
| Skill | Employment reach | Workers |
|---|---|---|
| Active Listening | 94.7% | 14,759,910 |
| Speaking | 79.5% | 12,393,990 |
| Social Perceptiveness | 71.2% | 11,102,310 |
| Service Orientation | 70.8% | 11,033,420 |
| Reading Comprehension | 67.5% | 10,531,590 |
| Critical Thinking | 60.3% | 9,400,280 |
| Time Management | 59.9% | 9,337,300 |
| Monitoring | 57.7% | 8,998,710 |
| Writing | 49.0% | 7,646,450 |
| Coordination | 48.5% | 7,558,400 |
| Active Learning | 43.0% | 6,699,330 |
| Persuasion | 41.2% | 6,420,950 |
Knowledge areas
| Knowledge area | Employment reach | Workers |
|---|---|---|
| Customer and Personal Service | 93.8% | 14,631,700 |
| English Language | 89.1% | 13,888,640 |
| Sales and Marketing | 56.3% | 8,772,800 |
| Administration and Management | 49.9% | 7,780,860 |
| Administrative | 48.5% | 7,563,790 |
| Mathematics | 48.0% | 7,482,550 |
| Computers and Electronics | 25.3% | 3,952,930 |
| Production and Processing | 15.0% | 2,340,750 |
| Personnel and Human Resources | 14.7% | 2,287,940 |
| Economics and Accounting | 14.0% | 2,187,630 |
| Education and Training | 14.0% | 2,176,660 |
| Mechanical | 7.5% | 1,172,520 |
Abilities
| Abilitie | Employment reach | Workers |
|---|---|---|
| Near Vision | 97.5% | 15,205,000 |
| Oral Comprehension | 96.8% | 15,088,430 |
| Oral Expression | 94.0% | 14,652,010 |
| Information Ordering | 91.8% | 14,308,790 |
| Speech Recognition | 89.0% | 13,882,350 |
| Speech Clarity | 88.1% | 13,742,380 |
| Written Comprehension | 86.5% | 13,485,530 |
| Problem Sensitivity | 80.0% | 12,474,410 |
| Written Expression | 51.4% | 8,022,620 |
| Selective Attention | 40.4% | 6,304,220 |
| Deductive Reasoning | 37.1% | 5,792,430 |
| Inductive Reasoning | 34.7% | 5,409,830 |
Tool categories
| Tool category | Employment reach | Workers |
|---|---|---|
| Spreadsheet software | 97.4% | 15,186,450 |
| Office suite software | 96.0% | 14,975,580 |
| Data base user interface and query software | 90.5% | 14,105,510 |
| Internet browser software | 84.5% | 13,180,650 |
| Operating system software | 81.3% | 12,684,580 |
| Word processing software | 76.8% | 11,980,530 |
| Electronic mail software | 75.1% | 11,711,560 |
| Enterprise resource planning ERP software | 66.9% | 10,436,230 |
| Accounting software | 62.7% | 9,771,150 |
| Inventory management software | 57.5% | 8,960,480 |
| Presentation software | 53.2% | 8,295,210 |
| Point of sale POS software | 51.9% | 8,085,470 |
| Document management software | 47.3% | 7,368,970 |
| Desktop publishing software | 44.2% | 6,896,150 |
| Video creation and editing software | 43.7% | 6,808,620 |
Reach = share of industry employment in occupations where the requirement is significant; it is not a per-worker usage or proficiency measure. Skill, knowledge, and ability importance is from O*NET; tool use is reported presence of a technology category.
Largest occupations
The occupations that employ the most people in this industry, with their share of the industry's workforce and national median pay for the occupation (not industry-specific pay).
Showing the top 40 of 433 occupations by employment.
Most distinctive occupations
The occupations most unusually concentrated in this industry compared with the economy as a whole. The location quotient is how many times more common an occupation is here versus its economy-wide share (a value of 5 means five times as concentrated).
For a sector this broad, the location quotient has a ceiling set by the sector's own share of national employment, so the top values tend to cluster near that limit.
| Occupation | Concentration | Workers |
|---|---|---|
| Retail Salespersons | 8.97× | 3,445,820 |
| Floral Designers | 8.91× | 36,200 |
| First-Line Supervisors of Retail Sales Workers | 8.75× | 984,680 |
| Butchers and Meat Cutters | 8.33× | 117,950 |
| Bicycle Repairers | 8.32× | 10,590 |
| Motorcycle Mechanics | 8.26× | 11,710 |
| Cashiers | 8.23× | 2,619,890 |
| Pharmacy Aides | 8.01× | 33,290 |
| Tire Repairers and Changers | 7.99× | 86,110 |
| Parts Salespersons | 7.32× | 196,260 |
| Pharmacy Technicians | 7.01× | 345,940 |
| Recreational Vehicle Service Technicians | 6.99× | 13,230 |
| Stockers and Order Fillers | 6.51× | 1,829,910 |
| Hearing Aid Specialists | 6.36× | 6,810 |
| Musical Instrument Repairers and Tuners | 6.33× | 3,670 |
| Watch and Clock Repairers | 5.7× | 750 |
| Electronic Equipment Installers and Repairers, Motor Vehicles | 5.39× | 5,530 |
| Pharmacists | 5.15× | 171,400 |
| Jewelers and Precious Stone and Metal Workers | 5.09× | 12,050 |
| Automotive Service Technicians and Mechanics | 5.01× | 349,330 |
Sub-industries
More detailed industries within Retail Trade.
Write a report on thisheadline · factoids · citation
The Retail Trade workforce sits at the 54th percentile of AI task overlap — 15,593,500 U.S. workers
- Weighting every occupation by its real share of Retail Trade employment, the industry's workforce ranks in the 54th percentile (Moderate band) for AI task overlap — overlap with what AI can attempt, not a measure of jobs at risk.Eloundou et al. + Felten AIOE, weighted by BLS OEWS
- The industry employs about 15,593,500 U.S. workers across 433 occupations.BLS OEWS (May 2024)
- Employment-weighted typical annual pay is about $40,823.BLS OEWS (May 2024)
- Of AI use observed across this industry's occupations, 40% looks like augmentation rather than automation — from a Claude.ai sample, not a census.Anthropic Economic Index
The Retail Trade workforce sits at the 54th percentile of AI task overlap — 15,593,500 U.S. workers

• Weighting every occupation by its real share of Retail Trade employment, the industry's workforce ranks in the 54th percentile (Moderate band) for AI task overlap — overlap with what AI can attempt, not a measure of jobs at risk. (Eloundou et al. + Felten AIOE, weighted by BLS OEWS)
• The industry employs about 15,593,500 U.S. workers across 433 occupations. (BLS OEWS (May 2024))
• Employment-weighted typical annual pay is about $40,823. (BLS OEWS (May 2024))
• Of AI use observed across this industry's occupations, 40% looks like augmentation rather than automation — from a Claude.ai sample, not a census. (Anthropic Economic Index)

Source: Singulariki — "Retail Trade". https://singulariki.com/industries/44-45
Note: AI task overlap measures what today's AI can attempt, not automation, job loss, or a forecast.
AssetsShare imageMethodology & sourcesPress & newsroomThe newsroom
Every line is built only from figures this page already shows and cites. AI task overlap means what today's AI can attempt — not automation, job loss, or a forecast.
Sources for this page
Every figure above traces to a named public dataset and the exact release below — not hand-written opinion. See the full methodology for what each measure does and does not mean.
- O*NET 30.3 U.S. Department of Labor / National Center for O*NET Development
- BLS Occupational Employment and Wage Statistics (OEWS) May 2024 U.S. Bureau of Labor Statistics
- Census NAICS 2022 U.S. Census Bureau
- Anthropic Economic Index v4 (2026-01-15) + v2 (2025-03-27) Anthropic
- “GPTs are GPTs” (Eloundou et al.) arXiv 2303.10130 OpenAI / academic
- AI Occupational Exposure (AIOE) Felten, Raj & Seamans academic
Data compiled June 3, 2026. Figures are estimates, not advice.
Cite this page
Singulariki. "Retail Trade." Singulariki: a source-backed encyclopedia of work. Built from O*NET 30.3; BLS Occupational Employment and Wage Statistics (OEWS) May 2024; Census NAICS 2022; Anthropic Economic Index v4 (2026-01-15) + v2 (2025-03-27); “GPTs are GPTs” (Eloundou et al.) arXiv 2303.10130; AI Occupational Exposure (AIOE) Felten, Raj & Seamans. Accessed June 7, 2026. https://singulariki.com/industries/44-45
Singulariki. (2026). Retail Trade. Singulariki: a source-backed encyclopedia of work. Retrieved June 7, 2026, from https://singulariki.com/industries/44-45
@misc{singulariki-44-45,
  title  = {Retail Trade},
  author = {{Singulariki}},
  year   = {2026},
  note   = {O*NET 30.3; BLS Occupational Employment and Wage Statistics (OEWS) May 2024; Census NAICS 2022; Anthropic Economic Index v4 (2026-01-15) + v2 (2025-03-27); “GPTs are GPTs” (Eloundou et al.) arXiv 2303.10130; AI Occupational Exposure (AIOE) Felten, Raj & Seamans. Accessed June 7, 2026},
  url    = {https://singulariki.com/industries/44-45}
} Citations name the underlying public dataset releases — they reflect what this page is built from, not just the URL.