Pharmacies and Drug Retailers
National industry · NAICS 456110
A source-stamped Markdown brief of this occupation — paste it into an agent, or fetch
/industries/456110/context.md directly.
Pharmacies and Drug Retailers is a U.S. industry in the NAICS classification. The Bureau of Labor Statistics estimates about 708,550 workers across 132 detailed occupations in it. A typical worker earns around $57,682 a year (Singulariki estimate, see below).
This industry comprises establishments generally known as pharmacies and drug retailers engaged in retailing prescription or nonprescription drugs and medicines. Cross-References. Establishments primarily engaged in--
Employment is national May 2024 OEWS. "Typical pay" is Singulariki's own figure — the employment-weighted average of each occupation's national median wage — a rough center of the industry, not an official BLS number.
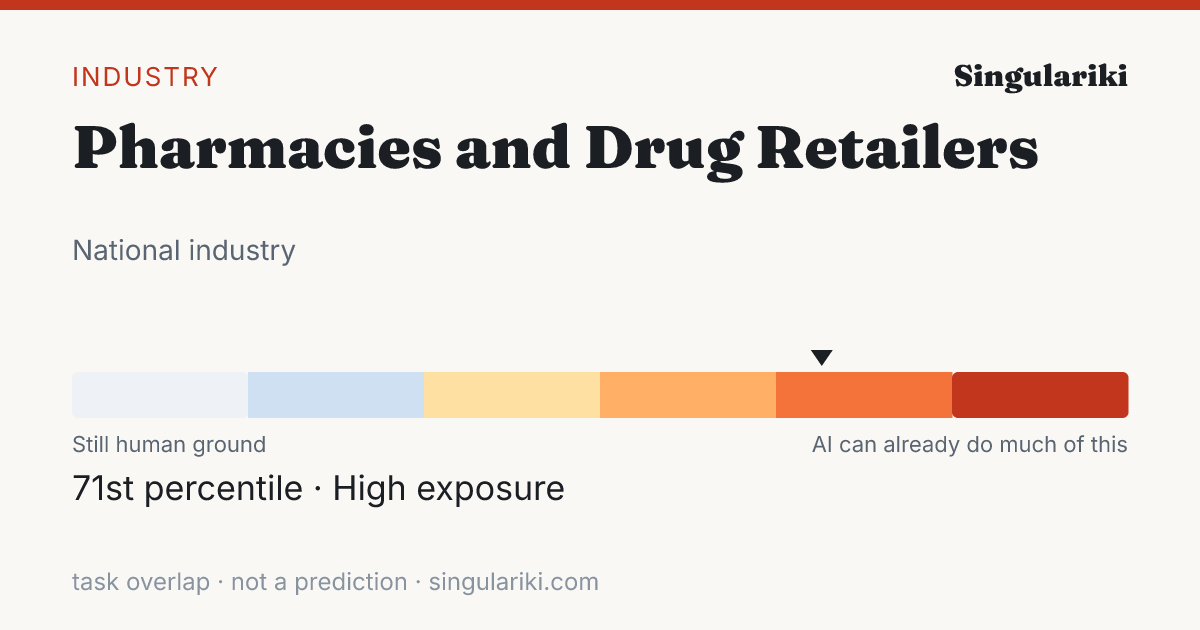
How exposed this industry is to AI
Weighting every occupation in this industry by its employment and its unified AI-exposure index (the OpenAI "GPTs are GPTs" human-rated task overlap folded with the Felten/Raj/Seamans AIOE index), this industry sits in the High band — 71st percentile across all industries.
Exposure measures how much of the work overlaps with what today's AI can do, not a prediction of automation; high-exposure industries are where AI is most likely to reshape tasks. Employment-weighted across 114 occupations that carry an exposure score. Compare every industry on the AI exposure hub.
How AI is actually used in this industry
Among measured Claude.ai (Free and Pro) conversations mapped to O*NET task statements (Anthropic Economic Index, 2026-01-15), these patterns are most associated with the occupations in this industry, weighted by its employment mix. They are shares of observed AI conversations — not of worker time, revenue, or what could be automated — and reflect one AI assistant's consumer sample, not all AI.
| Signal coverage | 93.8% of employment · 79/120 occupations have AEI task data |
| Augmentation vs. automation | 33.9% working with AI · 25.8% handed to AI |
| Most common pattern | none · |
| Typical AI autonomy | 3.2 / 5 · higher = AI acts more independently |
Tasks driving the signal
The task families that account for the most AI activity across this industry's occupations (employment × observed usage), each attributed to the occupation it comes from.
| Task | Occupation | How | Share of signal |
|---|---|---|---|
| Answer customers' questions, and provide information on procedures or policies. | Cashiers | Directive | 51.1% |
| Provide information and advice regarding drug interactions, side effects, dosage, and proper medication storage. | Pharmacists | Learning | 15.4% |
| Assist customers by providing information and resolving their complaints. | Cashiers | Iteration | 7.0% |
| Troubleshoot problems involving office equipment, such as computer hardware and software. | Office Clerks, General | Feedback loop | 4.0% |
| Answer telephones, responding to questions or requests. | Pharmacy Technicians | none | 2.6% |
| Greet customers entering establishments. | Cashiers | none | 2.4% |
| Assess the identity, strength, or purity of medications. | Pharmacists | Learning | 1.5% |
| Provide customers with information about the uses, effects, or interactions of drugs. | Pharmacy Aides | Learning | 1.1% |
| Receive payment by cash, check, credit cards, vouchers, or automatic debits. | Cashiers | Learning | 1.0% |
| Compound and dispense medications as prescribed by doctors and dentists, by calculating, weighing, measuring, and mixing ingredients, or oversee these activities. | Pharmacists | Learning | 0.9% |
| Recommend, select, and help locate or obtain merchandise based on customer needs and desires. | Retail Salespersons | Iteration | 0.9% |
| Greet customers and ascertain what each customer wants or needs. | Retail Salespersons | none | 0.8% |
Occupations behind the signal
The occupations whose AI-touched tasks contribute most to this industry's signal, by employment here.
| Occupation | Workers | Share | How they use AI |
|---|---|---|---|
| Pharmacy Technicians | 256,330 | 36.2% | none |
| Cashiers | 135,420 | 19.1% | Directive |
| Pharmacists | 125,310 | 17.7% | Learning |
| Pharmacy Aides | 27,500 | 3.9% | Learning |
| General and Operations Managers | 26,190 | 3.7% | Iteration |
| First-Line Supervisors of Retail Sales Workers | 11,430 | 1.6% | Iteration |
| Customer Service Representatives | 11,260 | 1.6% | Directive |
| Retail Salespersons | 11,100 | 1.6% | none |
| Shipping, Receiving, and Inventory Clerks | 5,520 | 0.8% | Iteration |
| Driver/Sales Workers | 5,410 | 0.8% | none |
| Office Clerks, General | 4,930 | 0.7% | Feedback loop |
| First-Line Supervisors of Office and Administrative Support Workers | 4,090 | 0.6% | Iteration |
This rollup is only as complete as the occupation-task matches available for the industry; the coverage figure above is shown so sparse industries do not look falsely precise. AI exposure is not the same as replacement.
Skill & tool metabolism
What this industry's work actually runs on. Each figure is the share of the industry's workers in occupations that significantly rely on a skill, knowledge area, or ability (O*NET importance ≥ 3 of 5), or that use a tool category — its employment reach. This is a measure of how widespread a requirement is across the workforce, not how intensively any one worker uses it. Shares are independent and need not add to 100%.
Based on 99.4% of this industry's employment that maps to a detailed occupation with an O*NET skill profile.
Skills
| Skill | Employment reach | Workers |
|---|---|---|
| Active Listening | 99.1% | 702,140 |
| Speaking | 96.3% | 682,520 |
| Social Perceptiveness | 92.0% | 651,910 |
| Service Orientation | 91.5% | 648,640 |
| Reading Comprehension | 79.7% | 564,400 |
| Critical Thinking | 77.1% | 546,100 |
| Time Management | 73.2% | 518,340 |
| Monitoring | 71.8% | 508,660 |
| Coordination | 70.9% | 502,040 |
| Writing | 69.7% | 494,200 |
| Judgment and Decision Making | 68.5% | 485,340 |
| Complex Problem Solving | 66.5% | 471,440 |
Knowledge areas
| Knowledge area | Employment reach | Workers |
|---|---|---|
| English Language | 99.1% | 701,850 |
| Customer and Personal Service | 98.2% | 695,930 |
| Administrative | 72.1% | 510,900 |
| Mathematics | 67.6% | 478,650 |
| Computers and Electronics | 63.6% | 450,380 |
| Medicine and Dentistry | 55.2% | 391,000 |
| Production and Processing | 41.4% | 293,620 |
| Law and Government | 37.9% | 268,270 |
| Sales and Marketing | 28.8% | 203,800 |
| Education and Training | 22.3% | 158,050 |
| Psychology | 19.6% | 139,060 |
| Biology | 18.4% | 130,220 |
Abilities
| Abilitie | Employment reach | Workers |
|---|---|---|
| Near Vision | 99.4% | 703,970 |
| Oral Comprehension | 99.4% | 703,970 |
| Oral Expression | 99.2% | 702,970 |
| Speech Recognition | 99.0% | 701,250 |
| Information Ordering | 98.9% | 700,790 |
| Speech Clarity | 98.8% | 700,030 |
| Written Comprehension | 98.8% | 699,970 |
| Problem Sensitivity | 96.4% | 682,850 |
| Deductive Reasoning | 75.4% | 534,120 |
| Written Expression | 74.5% | 528,140 |
| Category Flexibility | 72.5% | 513,350 |
| Inductive Reasoning | 71.6% | 507,010 |
Tool categories
| Tool category | Employment reach | Workers |
|---|---|---|
| Office suite software | 99.6% | 705,700 |
| Spreadsheet software | 99.6% | 705,750 |
| Data base user interface and query software | 99.0% | 701,390 |
| Internet browser software | 91.5% | 648,280 |
| Medical software | 84.0% | 595,380 |
| Electronic mail software | 79.5% | 563,370 |
| Word processing software | 77.9% | 552,300 |
| Presentation software | 74.7% | 529,370 |
| Inventory management software | 64.3% | 455,600 |
| Enterprise resource planning ERP software | 55.4% | 392,650 |
| Label making software | 54.7% | 387,470 |
| Accounting software | 51.8% | 367,290 |
| Operating system software | 42.9% | 303,780 |
| Billing and invoicing software | 38.9% | 275,780 |
| Document management software | 34.1% | 241,700 |
Reach = share of industry employment in occupations where the requirement is significant; it is not a per-worker usage or proficiency measure. Skill, knowledge, and ability importance is from O*NET; tool use is reported presence of a technology category.
Largest occupations
The occupations that employ the most people in this industry, with their share of the industry's workforce and national median pay for the occupation (not industry-specific pay).
Showing the top 40 of 132 occupations by employment.
Most distinctive occupations
The occupations most unusually concentrated in this industry compared with the economy as a whole. The location quotient is how many times more common an occupation is here versus its economy-wide share (a value of 5 means five times as concentrated).
| Occupation | Concentration | Workers |
|---|---|---|
| Pharmacy Aides | 145.6× | 27,500 |
| Pharmacy Technicians | 114.32× | 256,330 |
| Pharmacists | 82.92× | 125,310 |
| Cashiers | 9.36× | 135,420 |
| Driver/Sales Workers | 2.82× | 5,410 |
| Couriers and Messengers | 2.81× | 930 |
| Light Truck Drivers | 2.7× | 12,330 |
| Order Clerks | 2.24× | 860 |
| First-Line Supervisors of Retail Sales Workers | 2.23× | 11,430 |
| Data Entry Keyers | 2.04× | 1,270 |
| Billing and Posting Clerks | 1.68× | 3,220 |
| General and Operations Managers | 1.59× | 26,190 |
| Shipping, Receiving, and Inventory Clerks | 1.4× | 5,520 |
| Stockers and Order Fillers | 1.35× | 17,220 |
| Medical and Health Services Managers | 1.33× | 3,450 |
| Insurance Claims and Policy Processing Clerks | 1.31× | 1,380 |
| Sales and Related Workers, All Other | 1.1× | 500 |
| Medical Equipment Repairers | 0.93× | 260 |
| Customer Service Representatives | 0.9× | 11,260 |
| Healthcare Practitioners and Technical Workers, All Other | 0.77× | 130 |
Write a report on thisheadline · factoids · citation
The Pharmacies and Drug Retailers workforce sits at the 71st percentile of AI task overlap — 708,550 U.S. workers
- Weighting every occupation by its real share of Pharmacies and Drug Retailers employment, the industry's workforce ranks in the 71st percentile (High band) for AI task overlap — overlap with what AI can attempt, not a measure of jobs at risk.Eloundou et al. + Felten AIOE, weighted by BLS OEWS
- The industry employs about 708,550 U.S. workers across 132 occupations.BLS OEWS (May 2024)
- Employment-weighted typical annual pay is about $57,682.BLS OEWS (May 2024)
- Of AI use observed across this industry's occupations, 34% looks like augmentation rather than automation — from a Claude.ai sample, not a census.Anthropic Economic Index
The Pharmacies and Drug Retailers workforce sits at the 71st percentile of AI task overlap — 708,550 U.S. workers

• Weighting every occupation by its real share of Pharmacies and Drug Retailers employment, the industry's workforce ranks in the 71st percentile (High band) for AI task overlap — overlap with what AI can attempt, not a measure of jobs at risk. (Eloundou et al. + Felten AIOE, weighted by BLS OEWS)
• The industry employs about 708,550 U.S. workers across 132 occupations. (BLS OEWS (May 2024))
• Employment-weighted typical annual pay is about $57,682. (BLS OEWS (May 2024))
• Of AI use observed across this industry's occupations, 34% looks like augmentation rather than automation — from a Claude.ai sample, not a census. (Anthropic Economic Index)

Source: Singulariki — "Pharmacies and Drug Retailers". https://singulariki.com/industries/456110
Note: AI task overlap measures what today's AI can attempt, not automation, job loss, or a forecast.
AssetsShare imageMethodology & sourcesPress & newsroomThe newsroom
Every line is built only from figures this page already shows and cites. AI task overlap means what today's AI can attempt — not automation, job loss, or a forecast.
Sources for this page
Every figure above traces to a named public dataset and the exact release below — not hand-written opinion. See the full methodology for what each measure does and does not mean.
- O*NET 30.3 U.S. Department of Labor / National Center for O*NET Development
- BLS Occupational Employment and Wage Statistics (OEWS) May 2024 U.S. Bureau of Labor Statistics
- Census NAICS 2022 U.S. Census Bureau
- Anthropic Economic Index v4 (2026-01-15) + v2 (2025-03-27) Anthropic
- “GPTs are GPTs” (Eloundou et al.) arXiv 2303.10130 OpenAI / academic
- AI Occupational Exposure (AIOE) Felten, Raj & Seamans academic
Data compiled June 3, 2026. Figures are estimates, not advice.
Cite this page
Singulariki. "Pharmacies and Drug Retailers." Singulariki: a source-backed encyclopedia of work. Built from O*NET 30.3; BLS Occupational Employment and Wage Statistics (OEWS) May 2024; Census NAICS 2022; Anthropic Economic Index v4 (2026-01-15) + v2 (2025-03-27); “GPTs are GPTs” (Eloundou et al.) arXiv 2303.10130; AI Occupational Exposure (AIOE) Felten, Raj & Seamans. Accessed June 7, 2026. https://singulariki.com/industries/456110
Singulariki. (2026). Pharmacies and Drug Retailers. Singulariki: a source-backed encyclopedia of work. Retrieved June 7, 2026, from https://singulariki.com/industries/456110
@misc{singulariki-456110,
  title  = {Pharmacies and Drug Retailers},
  author = {{Singulariki}},
  year   = {2026},
  note   = {O*NET 30.3; BLS Occupational Employment and Wage Statistics (OEWS) May 2024; Census NAICS 2022; Anthropic Economic Index v4 (2026-01-15) + v2 (2025-03-27); “GPTs are GPTs” (Eloundou et al.) arXiv 2303.10130; AI Occupational Exposure (AIOE) Felten, Raj & Seamans. Accessed June 7, 2026},
  url    = {https://singulariki.com/industries/456110}
} Citations name the underlying public dataset releases — they reflect what this page is built from, not just the URL.