Sporting Goods Retailers
National industry · NAICS 459110
A source-stamped Markdown brief of this occupation — paste it into an agent, or fetch
/industries/459110/context.md directly.
Sporting Goods Retailers is a U.S. industry in the NAICS classification. The Bureau of Labor Statistics estimates about 297,700 workers across 124 detailed occupations in it. A typical worker earns around $39,410 a year (Singulariki estimate, see below).
This industry comprises establishments primarily engaged in retailing new sporting goods, such as bicycles and bicycle parts; camping equipment; exercise and fitness equipment; athletic uniforms; specialty sports footwear; and other sporting goods, equipment, and accessories. Illustrative Examples: Athletic uniform supply retailers Fishing supply retailers Bicycle (except motorized) retailers Golf pro shops Bowling equipment and supply retailers Tack shops Diving equipment retailers Sporting goods (e.g., scuba, skiing, ball sports) retailers Exercise equipment retailers Sporting gun and hunting equipment retailers Camping and hiking equipment retailers Cross-References. Establishments primarily engaged in--
Employment is national May 2024 OEWS. "Typical pay" is Singulariki's own figure — the employment-weighted average of each occupation's national median wage — a rough center of the industry, not an official BLS number.
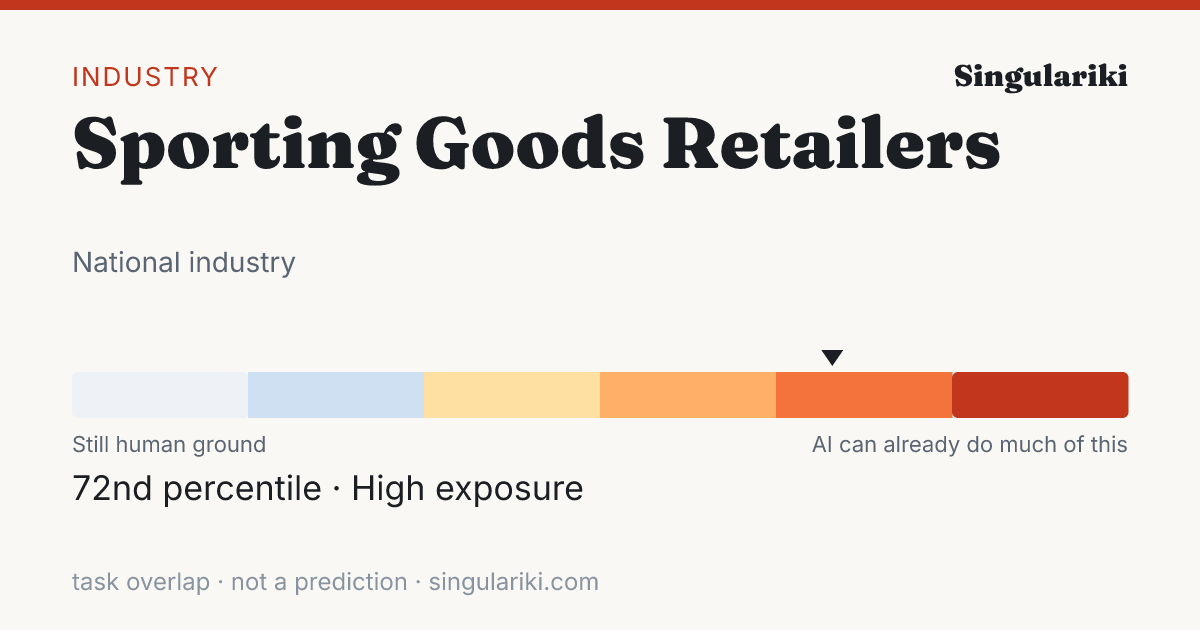
How exposed this industry is to AI
Weighting every occupation in this industry by its employment and its unified AI-exposure index (the OpenAI "GPTs are GPTs" human-rated task overlap folded with the Felten/Raj/Seamans AIOE index), this industry sits in the High band — 72nd percentile across all industries.
Exposure measures how much of the work overlaps with what today's AI can do, not a prediction of automation; high-exposure industries are where AI is most likely to reshape tasks. Employment-weighted across 104 occupations that carry an exposure score. Compare every industry on the AI exposure hub.
How AI is actually used in this industry
Among measured Claude.ai (Free and Pro) conversations mapped to O*NET task statements (Anthropic Economic Index, 2026-01-15), these patterns are most associated with the occupations in this industry, weighted by its employment mix. They are shares of observed AI conversations — not of worker time, revenue, or what could be automated — and reflect one AI assistant's consumer sample, not all AI.
| Signal coverage | 85.3% of employment · 71/111 occupations have AEI task data |
| Augmentation vs. automation | 37.4% working with AI · 31.0% handed to AI |
| Most common pattern | Directive · AI does it; you give the instruction |
| Typical AI autonomy | 3.8 / 5 · higher = AI acts more independently |
Tasks driving the signal
The task families that account for the most AI activity across this industry's occupations (employment × observed usage), each attributed to the occupation it comes from.
| Task | Occupation | How | Share of signal |
|---|---|---|---|
| Recommend, select, and help locate or obtain merchandise based on customer needs and desires. | Retail Salespersons | Iteration | 24.3% |
| Greet customers and ascertain what each customer wants or needs. | Retail Salespersons | none | 23.5% |
| Answer customers' questions, and provide information on procedures or policies. | Cashiers | Directive | 16.9% |
| Describe merchandise and explain use, operation, and care of merchandise to customers. | Retail Salespersons | Learning | 8.2% |
| Troubleshoot problems involving office equipment, such as computer hardware and software. | Office Clerks, General | Feedback loop | 6.3% |
| Answer questions regarding the store and its merchandise. | Retail Salespersons | Directive | 3.9% |
| Assist customers by providing information and resolving their complaints. | Cashiers | Iteration | 2.3% |
| Provide customer service by greeting and assisting customers and responding to customer inquiries and complaints. | First-Line Supervisors of Retail Sales Workers | Directive | 0.9% |
| Prepare merchandise for purchase or rental. | Retail Salespersons | Directive | 0.9% |
| Greet customers entering establishments. | Cashiers | none | 0.8% |
| Conduct classes, workshops, and demonstrations, and provide individual instruction to teach topics and skills such as cooking, dancing, writing, physical fitness, photography, personal finance, and flying. | Self-Enrichment Teachers | Learning | 0.7% |
| Confer with company officials to develop methods and procedures to increase sales, expand markets, and promote business. | First-Line Supervisors of Retail Sales Workers | Iteration | 0.6% |
Occupations behind the signal
The occupations whose AI-touched tasks contribute most to this industry's signal, by employment here.
| Occupation | Workers | Share | How they use AI |
|---|---|---|---|
| Retail Salespersons | 145,500 | 48.9% | none |
| First-Line Supervisors of Retail Sales Workers | 23,290 | 7.8% | Iteration |
| Cashiers | 21,140 | 7.1% | Directive |
| General and Operations Managers | 12,690 | 4.3% | Iteration |
| Customer Service Representatives | 8,670 | 2.9% | Directive |
| Shipping, Receiving, and Inventory Clerks | 7,650 | 2.6% | Iteration |
| Office Clerks, General | 3,630 | 1.2% | Feedback loop |
| Bookkeeping, Accounting, and Auditing Clerks | 2,690 | 0.9% | Directive |
| Sales Managers | 2,490 | 0.8% | Iteration |
| Merchandise Displayers and Window Trimmers | 1,940 | 0.7% | Iteration |
| Self-Enrichment Teachers | 1,890 | 0.6% | Learning |
| Sales Representatives, Wholesale and Manufacturing, Except Technical and Scientific Products | 1,740 | 0.6% | Directive |
This rollup is only as complete as the occupation-task matches available for the industry; the coverage figure above is shown so sparse industries do not look falsely precise. AI exposure is not the same as replacement.
Skill & tool metabolism
What this industry's work actually runs on. Each figure is the share of the industry's workers in occupations that significantly rely on a skill, knowledge area, or ability (O*NET importance ≥ 3 of 5), or that use a tool category — its employment reach. This is a measure of how widespread a requirement is across the workforce, not how intensively any one worker uses it. Shares are independent and need not add to 100%.
Based on 97.4% of this industry's employment that maps to a detailed occupation with an O*NET skill profile.
Skills
| Skill | Employment reach | Workers |
|---|---|---|
| Active Listening | 96.3% | 286,700 |
| Speaking | 91.6% | 272,780 |
| Reading Comprehension | 86.8% | 258,530 |
| Social Perceptiveness | 85.3% | 254,020 |
| Service Orientation | 83.6% | 249,000 |
| Critical Thinking | 83.5% | 248,580 |
| Monitoring | 78.8% | 234,620 |
| Time Management | 77.6% | 231,090 |
| Writing | 74.9% | 223,120 |
| Coordination | 73.2% | 217,860 |
| Active Learning | 69.0% | 205,530 |
| Persuasion | 69.0% | 205,540 |
Knowledge areas
| Knowledge area | Employment reach | Workers |
|---|---|---|
| English Language | 95.9% | 285,570 |
| Customer and Personal Service | 91.8% | 273,240 |
| Administration and Management | 78.1% | 232,420 |
| Mathematics | 76.2% | 226,930 |
| Administrative | 74.6% | 221,940 |
| Sales and Marketing | 74.6% | 221,960 |
| Computers and Electronics | 21.6% | 64,270 |
| Economics and Accounting | 15.3% | 45,530 |
| Personnel and Human Resources | 15.3% | 45,540 |
| Production and Processing | 14.7% | 43,890 |
| Education and Training | 13.5% | 40,120 |
| Mechanical | 6.2% | 18,600 |
Abilities
| Abilitie | Employment reach | Workers |
|---|---|---|
| Near Vision | 97.4% | 290,080 |
| Oral Comprehension | 96.8% | 288,290 |
| Oral Expression | 96.5% | 287,190 |
| Information Ordering | 95.9% | 285,610 |
| Speech Recognition | 95.2% | 283,510 |
| Speech Clarity | 95.0% | 282,820 |
| Written Comprehension | 93.9% | 279,660 |
| Problem Sensitivity | 92.2% | 274,360 |
| Written Expression | 78.7% | 234,360 |
| Deductive Reasoning | 34.6% | 103,000 |
| Inductive Reasoning | 33.9% | 100,880 |
| Category Flexibility | 31.5% | 93,920 |
Tool categories
| Tool category | Employment reach | Workers |
|---|---|---|
| Spreadsheet software | 97.6% | 290,700 |
| Data base user interface and query software | 94.0% | 279,870 |
| Office suite software | 94.0% | 279,880 |
| Internet browser software | 92.4% | 275,050 |
| Word processing software | 90.0% | 268,040 |
| Electronic mail software | 89.9% | 267,610 |
| Operating system software | 86.5% | 257,490 |
| Enterprise resource planning ERP software | 81.9% | 243,890 |
| Accounting software | 81.1% | 241,430 |
| Presentation software | 78.4% | 233,350 |
| Document management software | 77.3% | 230,020 |
| Desktop publishing software | 74.0% | 220,380 |
| Graphics or photo imaging software | 72.3% | 215,240 |
| Web page creation and editing software | 72.2% | 214,930 |
| Customer relationship management CRM software | 71.7% | 213,560 |
Reach = share of industry employment in occupations where the requirement is significant; it is not a per-worker usage or proficiency measure. Skill, knowledge, and ability importance is from O*NET; tool use is reported presence of a technology category.
Largest occupations
The occupations that employ the most people in this industry, with their share of the industry's workforce and national median pay for the occupation (not industry-specific pay).
Showing the top 40 of 124 occupations by employment.
Most distinctive occupations
The occupations most unusually concentrated in this industry compared with the economy as a whole. The location quotient is how many times more common an occupation is here versus its economy-wide share (a value of 5 means five times as concentrated).
| Occupation | Concentration | Workers |
|---|---|---|
| Bicycle Repairers | 424.13× | 10,310 |
| Retail Salespersons | 19.83× | 145,500 |
| First-Line Supervisors of Retail Sales Workers | 10.84× | 23,290 |
| Shoe and Leather Workers and Repairers | 10.17× | 150 |
| Installation, Maintenance, and Repair Workers, All Other | 7.42× | 2,630 |
| Sewing Machine Operators | 6× | 1,270 |
| Sales and Related Workers, All Other | 5.44× | 1,040 |
| Order Clerks | 5.4× | 870 |
| Merchandise Displayers and Window Trimmers | 5.22× | 1,940 |
| Textile, Apparel, and Furnishings Workers, All Other | 5.02× | 140 |
| Shipping, Receiving, and Inventory Clerks | 4.62× | 7,650 |
| Tour and Travel Guides | 4.02× | 380 |
| Cashiers | 3.48× | 21,140 |
| Outdoor Power Equipment and Other Small Engine Mechanics | 3.48× | 230 |
| Printing Press Operators | 3.39× | 950 |
| Pressers, Textile, Garment, and Related Materials | 3.28× | 170 |
| Self-Enrichment Teachers | 3.17× | 1,890 |
| Private Detectives and Investigators | 2.94× | 220 |
| Protective Service Workers, All Other | 2.24× | 360 |
| Photographers | 2.22× | 220 |
Write a report on thisheadline · factoids · citation
The Sporting Goods Retailers workforce sits at the 72nd percentile of AI task overlap — 297,700 U.S. workers
- Weighting every occupation by its real share of Sporting Goods Retailers employment, the industry's workforce ranks in the 72nd percentile (High band) for AI task overlap — overlap with what AI can attempt, not a measure of jobs at risk.Eloundou et al. + Felten AIOE, weighted by BLS OEWS
- The industry employs about 297,700 U.S. workers across 124 occupations.BLS OEWS (May 2024)
- Employment-weighted typical annual pay is about $39,410.BLS OEWS (May 2024)
- Of AI use observed across this industry's occupations, 37% looks like augmentation rather than automation — from a Claude.ai sample, not a census.Anthropic Economic Index
The Sporting Goods Retailers workforce sits at the 72nd percentile of AI task overlap — 297,700 U.S. workers

• Weighting every occupation by its real share of Sporting Goods Retailers employment, the industry's workforce ranks in the 72nd percentile (High band) for AI task overlap — overlap with what AI can attempt, not a measure of jobs at risk. (Eloundou et al. + Felten AIOE, weighted by BLS OEWS)
• The industry employs about 297,700 U.S. workers across 124 occupations. (BLS OEWS (May 2024))
• Employment-weighted typical annual pay is about $39,410. (BLS OEWS (May 2024))
• Of AI use observed across this industry's occupations, 37% looks like augmentation rather than automation — from a Claude.ai sample, not a census. (Anthropic Economic Index)

Source: Singulariki — "Sporting Goods Retailers". https://singulariki.com/industries/459110
Note: AI task overlap measures what today's AI can attempt, not automation, job loss, or a forecast.
AssetsShare imageMethodology & sourcesPress & newsroomThe newsroom
Every line is built only from figures this page already shows and cites. AI task overlap means what today's AI can attempt — not automation, job loss, or a forecast.
Sources for this page
Every figure above traces to a named public dataset and the exact release below — not hand-written opinion. See the full methodology for what each measure does and does not mean.
- O*NET 30.3 U.S. Department of Labor / National Center for O*NET Development
- BLS Occupational Employment and Wage Statistics (OEWS) May 2024 U.S. Bureau of Labor Statistics
- Census NAICS 2022 U.S. Census Bureau
- Anthropic Economic Index v4 (2026-01-15) + v2 (2025-03-27) Anthropic
- “GPTs are GPTs” (Eloundou et al.) arXiv 2303.10130 OpenAI / academic
- AI Occupational Exposure (AIOE) Felten, Raj & Seamans academic
Data compiled June 3, 2026. Figures are estimates, not advice.
Cite this page
Singulariki. "Sporting Goods Retailers." Singulariki: a source-backed encyclopedia of work. Built from O*NET 30.3; BLS Occupational Employment and Wage Statistics (OEWS) May 2024; Census NAICS 2022; Anthropic Economic Index v4 (2026-01-15) + v2 (2025-03-27); “GPTs are GPTs” (Eloundou et al.) arXiv 2303.10130; AI Occupational Exposure (AIOE) Felten, Raj & Seamans. Accessed June 7, 2026. https://singulariki.com/industries/459110
Singulariki. (2026). Sporting Goods Retailers. Singulariki: a source-backed encyclopedia of work. Retrieved June 7, 2026, from https://singulariki.com/industries/459110
@misc{singulariki-459110,
  title  = {Sporting Goods Retailers},
  author = {{Singulariki}},
  year   = {2026},
  note   = {O*NET 30.3; BLS Occupational Employment and Wage Statistics (OEWS) May 2024; Census NAICS 2022; Anthropic Economic Index v4 (2026-01-15) + v2 (2025-03-27); “GPTs are GPTs” (Eloundou et al.) arXiv 2303.10130; AI Occupational Exposure (AIOE) Felten, Raj & Seamans. Accessed June 7, 2026},
  url    = {https://singulariki.com/industries/459110}
} Citations name the underlying public dataset releases — they reflect what this page is built from, not just the URL.