Often handed to AI
Task areas most often handled directively in observed AI conversations — candidates to delegate with light review.
- Provide information about facilities, entertainment options, and rules and regulations. · 1.3%
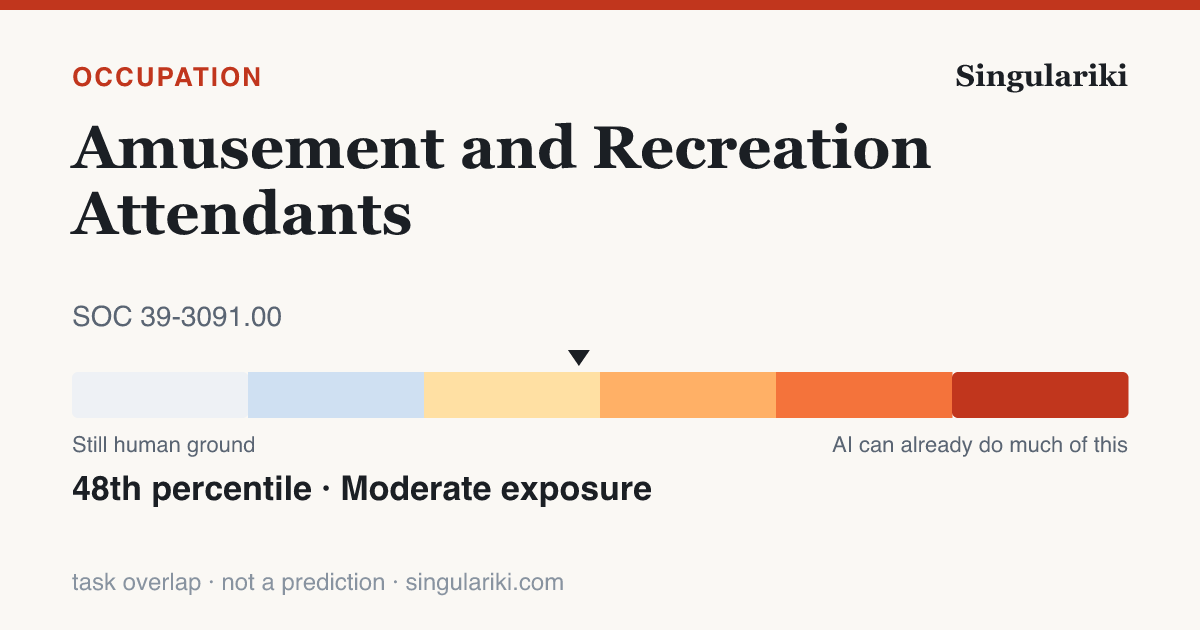
Occupation · SOC 39-3091.00
Perform a variety of attending duties at amusement or recreation facility. May schedule use of recreation facilities, maintain and provide equipment to participants of sporting events or recreational pursuits, or operate amusement concessions and rides.
Also called: Golf Course Ranger · Recreation Attendant · Ride Operator · Ski Lift Operator · Activities Attendant · Coaster Attendant · Golf Course Starter · Recreation Aide · Recreation Clerk · Sports Complex Attendant · Alley Worker · Amusement Attendant
Job family: Personal Care and Service Occupations
A source-stamped Markdown brief of this occupation — paste it into an agent, or fetch
/roles/role-39-3091-00/context.md directly.
A fast read on where AI already shows up in this occupation, where it stays a copilot, where humans remain in the loop, and what the labor market is doing. Built from observed Claude.ai conversations mapped to O*NET tasks and from published research — measures of usage and exposure, not advice or predictions that the job is going away.
Task areas most often handled directively in observed AI conversations — candidates to delegate with light review.
Task areas where a human was still judged necessary in a large share of observed conversations — not a safety ruling, an observed-need signal.
The capabilities O*NET rates most important for this occupation — the human ground the work is built on.
See all skills →Independent published positions, read together — not a forecast.
48th-percentile task overlap — yet about 102,400 openings a year (+3.4% projected, BLS), and observed AI use leans 5299% copilot, not hand-off (AEI) . What exposure means →
What today's research says about this occupation's exposure to AI, how AI is actually being used in it, and where employment is headed. These are positions within published studies — measures of exposure and usage, not predictions that this job will disappear.
Each study uses its own scale, so the raw scores are not comparable across rows — the percentile (this job's rank among all U.S. occupations with data) is the comparable figure, and sizes the bars.
| Measure | Rank vs all occupations | Percentile | Score |
|---|---|---|---|
| Overall AI exposure (Felten et al.) Moderate | 34th | -0.5 | |
| LLM task exposure, γ (OpenAI / Eloundou) Low | 27th | 0.2 | |
| AI assistant applicability (Microsoft) High | 86th | 0.3 |
OpenAI's exposure study scores tasks three ways: with a language model alone (α 0.2), with simple added tooling (β 0.2), and including AI-powered software (γ 0.2). Higher means more of the job's tasks could be done at least twice as fast — not that they will be automated away.
This job mostly cannot be done remotely (Dingel–Neiman) — its hands-on tasks sit outside what software-based AI reaches.
A pre-LLM (2013) estimate of how automatable this job is by computerization and robotics. Shown for historical context only — it is not part of any current AI ranking.
Frey–Osborne probability 0.7 · 59th percentile among occupations · Moderate
Among measured AI assistant conversations mapped to this occupation (Anthropic Economic Index, 2026-01-15), these task types came up most. These are shares of observed AI conversations — not shares of the job, of worker time, or of what could be automated.
| Provide information about facilities, entertainment options, and rules and regulations. | 1.8% |
Independent U.S. Bureau of Labor Statistics employment projection for 2024–2034 — a labor-market forecast, not an AI-impact forecast.
| Outlook | About average · +3.4% by 2034 |
| Projected annual openings | 102,400 |
| Employment 2024 → 2034 | 392,300 → 405,500 |
“Annual openings” counts new jobs plus replacements for workers who leave the occupation, so it can be large even when growth is modest.
The ILO's 2025 global study scores generative-AI exposure on the international ISCO-08 occupation system, not US SOC. Bridged through the published (and approximate, many-to-many) IBS O*NET-SOC ↔ ISCO-08 crosswalk, this US occupation corresponds to the international 2 occupations below. Exposure here means how much of the work's tasks today's AI can attempt — task overlap, not automation, adoption, or jobs lost.
| International occupation (ISCO-08) | Task exposure (2025) | Most tasks fall in |
|---|---|---|
| Elementary Workers Not Elsewhere Classified · 9629 | 29% | Minimal |
| Crane, hoist and related plant operators · 8343 | 18% | Not exposed |
Read the whole six-band gradient on the GenAI exposure gradient page. The crosswalk is approximate: a US occupation can map to several international ones, and the ILO scores describe the international occupation, not this exact US role.
How people actually apply AI to this occupation's tasks, from Claude.ai (Free and Pro) conversations in the Anthropic Economic Index, 2026-01-15. This is one AI assistant's consumer sample — not all AI, not the whole workforce. Autonomy and the collaboration mix are model-rated estimates; figures below the sample floor are hidden.
| Augmentation vs. automation | 53.0% working with AI · 39.5% handed to AI |
| Most common way people use AI here | Directive · AI does it; you give the instruction |
| Typical AI autonomy | 3.0 / 5 · higher = AI acts more independently |
| Used for work (vs. personal / coursework) | 32.8% |
The role's most common tasks in AI conversations, each tagged with how people work with the AI on it. “Usage” is the share of observed conversations, not of the job.
| Task | How | Usage |
|---|---|---|
| Provide information about facilities, entertainment options, and rules and regulations. | Directive | 1.3% |
Tasks where the model most often judged that a person remained necessary — a useful read on the current boundary, not a guarantee.
| Provide information about facilities, entertainment options, and rules and regulations. | 98.5% |
Example prompts phrased from the tasks people most often delegate to AI in this occupation (Anthropic Economic Index). Each shows the underlying measured task and its share of observed AI use. They are suggested phrasings of real tasks — starting points, not endorsed instructions.
Help me provide information about facilities, entertainment options, and rules and regulations. From: Provide information about facilities, entertainment options, and rules and regulations. · 1.3% of measured AI use · directive
All 19 tasks O*NET lists for this occupation, ordered by importance. Each links to its own page with AI-exposure and observed-use detail.
O*NET importance rating, from 1 (not important) to 5 (extremely important).
| Speech Clarity | 3.9 | |
| Oral Comprehension | 3.8 | |
| Oral Expression | 3.8 | |
| Problem Sensitivity | 3.5 | |
| Speech Recognition | 3.4 | |
| Near Vision | 3.0 | |
| Information Ordering | 2.9 | |
| Selective Attention | 2.9 | |
| Written Comprehension | 2.8 | |
| Deductive Reasoning | 2.8 | |
| Inductive Reasoning | 2.8 | |
| Arm-Hand Steadiness | 2.8 | |
| Trunk Strength | 2.8 | |
| Far Vision | 2.8 | |
| Written Expression | 2.6 | |
| Manual Dexterity | 2.6 | |
| Control Precision | 2.6 | |
| Multilimb Coordination | 2.5 |
| Speaking | 3.3 | |
| Active Listening | 3.0 | |
| Monitoring | 2.9 | |
| Critical Thinking | 2.8 | |
| Writing | 2.5 | |
| Reading Comprehension | 2.4 | |
| Active Learning | 2.4 |
| Service Orientation | 3.1 | |
| Social Perceptiveness | 3.0 | |
| Coordination | 2.9 | |
| Judgment and Decision Making | 2.6 | |
| Time Management | 2.6 | |
| Persuasion | 2.4 |
Skills employers ask for in job postings for this occupation (Lightcast), with whether each is a common or specialized skill.
| Example | Category | |
|---|---|---|
| Web page creation and editing software | Hot technology | |
| Microsoft Excel | Spreadsheet software | Hot technology |
| Microsoft Office software | Office suite software | Hot technology |
| Microsoft Outlook | Electronic mail software | Hot technology |
| Microsoft Windows | Operating system software | Hot technology |
| Microsoft Word | Word processing software | Hot technology |
| Adobe PageMaker | Desktop publishing software | |
| Database software | Data base user interface and query software | |
| Microsoft Internet Explorer | Internet browser software |
How characteristic each condition is of the job, on O*NET's 1–5 context scale (higher = more present in day-to-day work). Each condition links to how it varies across all occupations.
Share of people in this occupation at each level of education.
| Less than a High School Diploma | 64.2% | |
| High School Diploma | 31.9% | |
| Associate's Degree (or other 2-year degree) | 2.5% | |
| Bachelor's Degree | 1.4% |
The interests and personal qualities O*NET associates with people who do this work.
| Conventional | 4.7 | |
| Social | 4.3 | |
| Realistic | 4.2 | |
| Enterprising | 3.8 | |
| Artistic | 1.7 |
| Personal Service | 4.4 | |
| Sales | 2.7 | |
| Physical/Manual Labor | 2.5 | |
| Transportation/Machine Operation | 2.4 | |
| Athletics | 2.2 | |
| Protective Service | 2.1 | |
| Accounting | 1.9 | |
| Public Speaking | 1.7 | |
| Management/Administration | 1.7 |
| Dependability | 2.1 | |
| Cooperation | 1.8 |
U.S. · annual wages (BLS OEWS)
| 10th percentile | $21,940 |
| 25th percentile | $26,430 |
| Median (50th) | $30,490 |
| 75th percentile | $35,360 |
| 90th percentile | $39,940 |
| People employed | 371,590 |
Where these workers are employed, by number of jobs (national, BLS OEWS). Pay shown is the occupation's national median, not industry-specific.
| Industry | Workers | National median pay |
|---|---|---|
| Arts, Entertainment, and Recreation · Sector | 276,690 | $29,910 |
| Fitness and Recreational Sports Centers · National industry | 51,150 | $31,580 |
| Accommodation and Food Services · Sector | 19,650 | $33,280 |
| Educational Services · Sector | 11,200 | $30,110 |
| Other Services (except Public Administration) · Sector | 7,550 | $31,290 |
| Administrative and Support and Waste Management and Remediation Services · Sector | 4,710 | $33,280 |
| Real Estate and Rental and Leasing · Sector | 4,270 | $33,080 |
| Casino Hotels · National industry | 2,750 | $29,770 |
| Temporary Help Services · National industry | 2,480 | $32,770 |
| Information · Sector | 1,900 | $25,010 |
| Retail Trade · Sector | 1,680 | $30,170 |
| Sporting Goods Retailers · National industry | 1,380 | $31,190 |
Industries where this occupation is far more common than in the economy as a whole. The location quotient is how many times more concentrated it is here (a value of 5 means five times its economy-wide share).
| Industry | Concentration | Workers |
|---|---|---|
| Arts, Entertainment, and Recreation · Sector | 43.45× | 276,690 |
| Fitness and Recreational Sports Centers · National industry | 33.67× | 51,150 |
| Casino Hotels · National industry | 3.39× | 2,750 |
| Sporting Goods Retailers · National industry | 1.92× | 1,380 |
| Theater Companies and Dinner Theaters · National industry | 1.38× | 240 |
| Real Estate and Rental and Leasing · Sector | 0.75× | 4,270 |
| Other Services (except Public Administration) · Sector | 0.71× | 7,550 |
| Accommodation and Food Services · Sector | 0.57× | 19,650 |
Part of the Hospitality, Events, & Tourism career cluster.
Side-by-side comparisons place two occupations’ pay, preparation, skills, and AI exposure on the same page — same data, same scale, no forecast.
Options the data surfaces for Amusement and Recreation Attendants — not advice or a forecast. Each is a real cross-link you can follow into the evidence.
Capabilities this work builds that are used across many other occupations.
Occupations O*NET rates as related — the nearby moves on the map.
How people typically prepare for this work.
On the global GenAI exposure gradient this work sits around the 43rd percentile of 427 international occupations.
Amusement and Recreation Attendants show 48th-percentile AI task overlap — and about 102,400 annual U.S. openings
Amusement and Recreation Attendants show 48th-percentile AI task overlap — and about 102,400 annual U.S. openings

• Amusement and Recreation Attendants rank in the 48th percentile (Moderate band) for AI task overlap across U.S. occupations — a measure of how much of the work today's AI can attempt, not how much is automated. (Eloundou et al. (GPTs are GPTs) + Felten AIOE)
• The occupation is projected to see about 102,400 U.S. job openings per year (2024–34), counting growth and replacement — a labor-demand projection made independently of AI. (BLS Employment Projections 2024–34)
• BLS projects employment to be about average (+3.4%) from 2024 to 2034. (BLS Employment Projections 2024–34)
• Median annual pay is $30,490, across about 371,590 U.S. workers. (BLS OEWS (May 2024))
• Of the AI use actually observed for this work, 53% looks like augmentation (drafting, iterating, checking) rather than hands-off automation — from a Claude.ai usage sample, not a census. (2026-01-15-v4-plus-2025-03-27-v2)

Source: Singulariki — "Amusement and Recreation Attendants". https://singulariki.com/roles/role-39-3091-00
Note: AI task overlap measures what today's AI can attempt, not automation, job loss, or a forecast.
AssetsShare imageMethodology & sourcesPress & newsroomThe newsroom
Every line is built only from figures this page already shows and cites. AI task overlap means what today's AI can attempt — not automation, job loss, or a forecast.
Every figure above traces to a named public dataset and the exact release below — not hand-written opinion. See the full methodology for what each measure does and does not mean.
Data compiled June 2, 2026. Figures are estimates, not advice.
Singulariki. "Amusement and Recreation Attendants." Singulariki: a source-backed encyclopedia of work. Built from O*NET 30.3; BLS Occupational Employment and Wage Statistics (OEWS) May 2024; BLS Employment Projections 2024–2034; Anthropic Economic Index v4 (2026-01-15) + v2 (2025-03-27); Microsoft “Working with AI” working-with-ai; “GPTs are GPTs” (Eloundou et al.) arXiv 2303.10130; AI Occupational Exposure (AIOE) Felten, Raj & Seamans; ILO / Gmyrek et al. GenAI exposure gradient 2025; IBS O*NET-SOC ↔ ISCO-08 occupation crosswalk 2022; Frey & Osborne (2013) frey-osborne-automation; Dingel & Neiman (2020) dingel-neiman-workathome. Accessed June 7, 2026. https://singulariki.com/roles/role-39-3091-00
Singulariki. (2026). Amusement and Recreation Attendants. Singulariki: a source-backed encyclopedia of work. Retrieved June 7, 2026, from https://singulariki.com/roles/role-39-3091-00
@misc{singulariki-role-39-3091-00,
  title  = {Amusement and Recreation Attendants},
  author = {{Singulariki}},
  year   = {2026},
  note   = {O*NET 30.3; BLS Occupational Employment and Wage Statistics (OEWS) May 2024; BLS Employment Projections 2024–2034; Anthropic Economic Index v4 (2026-01-15) + v2 (2025-03-27); Microsoft “Working with AI” working-with-ai; “GPTs are GPTs” (Eloundou et al.) arXiv 2303.10130; AI Occupational Exposure (AIOE) Felten, Raj & Seamans; ILO / Gmyrek et al. GenAI exposure gradient 2025; IBS O*NET-SOC ↔ ISCO-08 occupation crosswalk 2022; Frey & Osborne (2013) frey-osborne-automation; Dingel & Neiman (2020) dingel-neiman-workathome. Accessed June 7, 2026},
  url    = {https://singulariki.com/roles/role-39-3091-00}
} Citations name the underlying public dataset releases — they reflect what this page is built from, not just the URL.