Educational Services
Sector · NAICS 61
A source-stamped Markdown brief of this occupation — paste it into an agent, or fetch
/industries/61/context.md directly.
Educational Services is a U.S. industry in the NAICS classification. The Bureau of Labor Statistics estimates about 13,640,920 workers across 610 detailed occupations in it. A typical worker earns around $61,049 a year (Singulariki estimate, see below).
The Sector as a Whole The Educational Services sector comprises establishments that provide instruction and training in a wide variety of subjects. This instruction and training is provided by specialized establishments, such as schools, colleges, universities, and training centers. These establishments may be privately owned and operated for profit or not for profit, or they may be publicly owned and operated. They may also offer food and/or accommodation services to their students. Educational services are usually delivered by teachers or instructors that explain, tell, demonstrate, supervise, and direct learning. Instruction is imparted in diverse settings, such as educational institutions, the workplace, or the home, and through diverse means, such as correspondence, television, the Internet, or other electronic and distance-learning methods. The training provided by these establishments may include the use of simulators and simulation methods. It can be adapted to the particular needs of the students, for example sign language can replace verbal language for teaching students with hearing impairments. All industries in the sector share this commonality of process, namely, labor inputs of instructors with the requisite subject matter expertise and teaching ability.
Employment is national May 2024 OEWS. "Typical pay" is Singulariki's own figure — the employment-weighted average of each occupation's national median wage — a rough center of the industry, not an official BLS number.
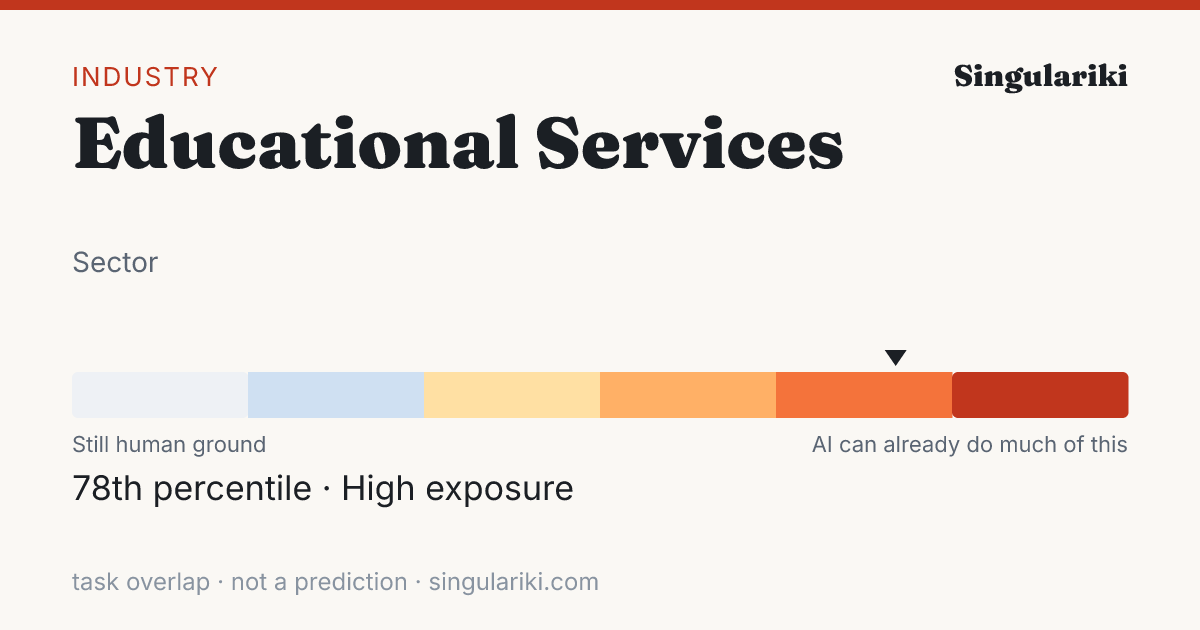
How exposed this industry is to AI
Weighting every occupation in this industry by its employment and its unified AI-exposure index (the OpenAI "GPTs are GPTs" human-rated task overlap folded with the Felten/Raj/Seamans AIOE index), this industry sits in the High band — 78th percentile across all industries.
Exposure measures how much of the work overlaps with what today's AI can do, not a prediction of automation; high-exposure industries are where AI is most likely to reshape tasks. Employment-weighted across 552 occupations that carry an exposure score. Compare every industry on the AI exposure hub.
How AI is actually used in this industry
Among measured Claude.ai (Free and Pro) conversations mapped to O*NET task statements (Anthropic Economic Index, 2026-01-15), these patterns are most associated with the occupations in this industry, weighted by its employment mix. They are shares of observed AI conversations — not of worker time, revenue, or what could be automated — and reflect one AI assistant's consumer sample, not all AI.
| Signal coverage | 68.4% of employment · 360/595 occupations have AEI task data |
| Augmentation vs. automation | 54.1% working with AI · 37.5% handed to AI |
| Most common pattern | Directive · AI does it; you give the instruction |
| Typical AI autonomy | 3.8 / 5 · higher = AI acts more independently |
Tasks driving the signal
The task families that account for the most AI activity across this industry's occupations (employment × observed usage), each attributed to the occupation it comes from.
| Task | Occupation | How | Share of signal |
|---|---|---|---|
| Instruct through lectures, discussions, and demonstrations in one or more subjects, such as English, mathematics, or social studies. | Secondary School Teachers, Except Special and Career/Technical Education | Learning | 7.7% |
| Troubleshoot problems involving office equipment, such as computer hardware and software. | Office Clerks, General | Feedback loop | 6.5% |
| Instruct individuals in career development techniques such as job search and application strategies, resume writing, and interview skills. | Educational, Guidance, and Career Counselors and Advisors | Iteration | 6.1% |
| Instruct through lectures, discussions, and demonstrations in one or more subjects, such as English, mathematics, or social studies. | Middle School Teachers, Except Special and Career/Technical Education | Learning | 4.5% |
| Develop instructional materials to be used by educators and instructors. | Instructional Coordinators | Iteration | 3.2% |
| Assist students who need extra help with their coursework outside of class. | English Language and Literature Teachers, Postsecondary | Iteration | 3.0% |
| Assist students who need extra help with their coursework outside of class. | Biological Science Teachers, Postsecondary | Iteration | 2.7% |
| Develop instructional materials, such as lesson plans, handouts, or examinations. | Instructional Coordinators | Iteration | 2.5% |
| Review class material with students by discussing text, working solutions to problems, or reviewing worksheets or other assignments. | Teachers and Instructors, All Other | Directive | 2.4% |
| Prepare, administer, and grade tests and assignments to evaluate students' progress. | Elementary School Teachers, Except Special Education | Directive | 2.0% |
| Use computers for various applications, such as database management or word processing. | Secretaries and Administrative Assistants, Except Legal, Medical, and Executive | Directive | 1.7% |
| Provide private instruction to individual or small groups of students to improve academic performance, improve occupational skills, or prepare for academic or occupational tests. | Teachers and Instructors, All Other | Learning | 1.7% |
Occupations behind the signal
The occupations whose AI-touched tasks contribute most to this industry's signal, by employment here.
| Occupation | Workers | Share | How they use AI |
|---|---|---|---|
| Elementary School Teachers, Except Special Education | 1,388,940 | 10.2% | Directive |
| Secondary School Teachers, Except Special and Career/Technical Education | 1,067,580 | 7.8% | Learning |
| Middle School Teachers, Except Special and Career/Technical Education | 619,200 | 4.5% | Learning |
| Secretaries and Administrative Assistants, Except Legal, Medical, and Executive | 353,220 | 2.6% | Directive |
| Education Administrators, Kindergarten through Secondary | 314,650 | 2.3% | Iteration |
| Educational, Guidance, and Career Counselors and Advisors | 305,520 | 2.2% | Iteration |
| Office Clerks, General | 304,860 | 2.2% | Feedback loop |
| Special Education Teachers, Kindergarten and Elementary School | 229,750 | 1.7% | Directive |
| Health Specialties Teachers, Postsecondary | 215,430 | 1.6% | Iteration |
| Self-Enrichment Teachers | 199,990 | 1.5% | Learning |
| Coaches and Scouts | 174,730 | 1.3% | Learning |
| Education Administrators, Postsecondary | 174,160 | 1.3% | Iteration |
This rollup is only as complete as the occupation-task matches available for the industry; the coverage figure above is shown so sparse industries do not look falsely precise. AI exposure is not the same as replacement.
Skill & tool metabolism
What this industry's work actually runs on. Each figure is the share of the industry's workers in occupations that significantly rely on a skill, knowledge area, or ability (O*NET importance ≥ 3 of 5), or that use a tool category — its employment reach. This is a measure of how widespread a requirement is across the workforce, not how intensively any one worker uses it. Shares are independent and need not add to 100%.
Based on 84.7% of this industry's employment that maps to a detailed occupation with an O*NET skill profile.
Skills
| Skill | Employment reach | Workers |
|---|---|---|
| Active Listening | 84.2% | 11,491,370 |
| Speaking | 83.6% | 11,410,580 |
| Critical Thinking | 79.5% | 10,847,140 |
| Reading Comprehension | 78.4% | 10,695,610 |
| Monitoring | 76.6% | 10,451,300 |
| Social Perceptiveness | 76.1% | 10,384,370 |
| Time Management | 74.5% | 10,158,310 |
| Writing | 74.3% | 10,141,740 |
| Coordination | 74.1% | 10,109,670 |
| Service Orientation | 73.7% | 10,058,440 |
| Judgment and Decision Making | 70.6% | 9,630,970 |
| Active Learning | 69.0% | 9,410,370 |
Knowledge areas
| Knowledge area | Employment reach | Workers |
|---|---|---|
| English Language | 81.2% | 11,076,610 |
| Customer and Personal Service | 75.1% | 10,247,630 |
| Education and Training | 63.4% | 8,641,970 |
| Computers and Electronics | 58.2% | 7,944,710 |
| Psychology | 49.1% | 6,702,790 |
| Administrative | 48.5% | 6,613,260 |
| Administration and Management | 45.5% | 6,204,210 |
| Mathematics | 42.7% | 5,824,050 |
| Public Safety and Security | 41.6% | 5,676,090 |
| Communications and Media | 27.3% | 3,719,140 |
| Sociology and Anthropology | 23.4% | 3,190,980 |
| Therapy and Counseling | 21.4% | 2,925,160 |
Abilities
| Abilitie | Employment reach | Workers |
|---|---|---|
| Near Vision | 84.6% | 11,537,620 |
| Oral Comprehension | 84.4% | 11,513,360 |
| Oral Expression | 84.1% | 11,478,790 |
| Problem Sensitivity | 82.5% | 11,257,900 |
| Speech Recognition | 81.0% | 11,053,270 |
| Speech Clarity | 80.9% | 11,037,440 |
| Deductive Reasoning | 79.3% | 10,812,690 |
| Written Comprehension | 78.1% | 10,654,980 |
| Inductive Reasoning | 77.4% | 10,551,610 |
| Information Ordering | 76.4% | 10,423,830 |
| Written Expression | 75.8% | 10,333,120 |
| Category Flexibility | 66.1% | 9,011,470 |
Tool categories
| Tool category | Employment reach | Workers |
|---|---|---|
| Spreadsheet software | 83.5% | 11,395,230 |
| Office suite software | 82.2% | 11,212,830 |
| Electronic mail software | 79.8% | 10,887,920 |
| Word processing software | 79.6% | 10,858,160 |
| Presentation software | 71.3% | 9,720,570 |
| Internet browser software | 69.9% | 9,538,160 |
| Data base user interface and query software | 69.6% | 9,492,730 |
| Computer based training software | 61.5% | 8,383,100 |
| Project management software | 58.5% | 7,982,120 |
| Document management software | 52.9% | 7,221,850 |
| Video creation and editing software | 50.9% | 6,938,200 |
| Cloud-based data access and sharing software | 47.7% | 6,500,060 |
| Video conferencing software | 45.5% | 6,200,560 |
| Desktop communications software | 43.5% | 5,940,580 |
| Analytical or scientific software | 43.1% | 5,873,290 |
Reach = share of industry employment in occupations where the requirement is significant; it is not a per-worker usage or proficiency measure. Skill, knowledge, and ability importance is from O*NET; tool use is reported presence of a technology category.
Largest occupations
The occupations that employ the most people in this industry, with their share of the industry's workforce and national median pay for the occupation (not industry-specific pay).
Showing the top 40 of 610 occupations by employment.
Most distinctive occupations
The occupations most unusually concentrated in this industry compared with the economy as a whole. The location quotient is how many times more common an occupation is here versus its economy-wide share (a value of 5 means five times as concentrated).
For a sector this broad, the location quotient has a ceiling set by the sector's own share of national employment, so the top values tend to cluster near that limit.
Write a report on thisheadline · factoids · citation
The Educational Services workforce sits at the 78th percentile of AI task overlap — 13,640,920 U.S. workers
- Weighting every occupation by its real share of Educational Services employment, the industry's workforce ranks in the 78th percentile (High band) for AI task overlap — overlap with what AI can attempt, not a measure of jobs at risk.Eloundou et al. + Felten AIOE, weighted by BLS OEWS
- The industry employs about 13,640,920 U.S. workers across 610 occupations.BLS OEWS (May 2024)
- Employment-weighted typical annual pay is about $61,049.BLS OEWS (May 2024)
- Of AI use observed across this industry's occupations, 54% looks like augmentation rather than automation — from a Claude.ai sample, not a census.Anthropic Economic Index
The Educational Services workforce sits at the 78th percentile of AI task overlap — 13,640,920 U.S. workers

• Weighting every occupation by its real share of Educational Services employment, the industry's workforce ranks in the 78th percentile (High band) for AI task overlap — overlap with what AI can attempt, not a measure of jobs at risk. (Eloundou et al. + Felten AIOE, weighted by BLS OEWS)
• The industry employs about 13,640,920 U.S. workers across 610 occupations. (BLS OEWS (May 2024))
• Employment-weighted typical annual pay is about $61,049. (BLS OEWS (May 2024))
• Of AI use observed across this industry's occupations, 54% looks like augmentation rather than automation — from a Claude.ai sample, not a census. (Anthropic Economic Index)

Source: Singulariki — "Educational Services". https://singulariki.com/industries/61
Note: AI task overlap measures what today's AI can attempt, not automation, job loss, or a forecast.
AssetsShare imageMethodology & sourcesPress & newsroomThe newsroom
Every line is built only from figures this page already shows and cites. AI task overlap means what today's AI can attempt — not automation, job loss, or a forecast.
Sources for this page
Every figure above traces to a named public dataset and the exact release below — not hand-written opinion. See the full methodology for what each measure does and does not mean.
- O*NET 30.3 U.S. Department of Labor / National Center for O*NET Development
- BLS Occupational Employment and Wage Statistics (OEWS) May 2024 U.S. Bureau of Labor Statistics
- Census NAICS 2022 U.S. Census Bureau
- Anthropic Economic Index v4 (2026-01-15) + v2 (2025-03-27) Anthropic
- “GPTs are GPTs” (Eloundou et al.) arXiv 2303.10130 OpenAI / academic
- AI Occupational Exposure (AIOE) Felten, Raj & Seamans academic
Data compiled June 3, 2026. Figures are estimates, not advice.
Cite this page
Singulariki. "Educational Services." Singulariki: a source-backed encyclopedia of work. Built from O*NET 30.3; BLS Occupational Employment and Wage Statistics (OEWS) May 2024; Census NAICS 2022; Anthropic Economic Index v4 (2026-01-15) + v2 (2025-03-27); “GPTs are GPTs” (Eloundou et al.) arXiv 2303.10130; AI Occupational Exposure (AIOE) Felten, Raj & Seamans. Accessed June 7, 2026. https://singulariki.com/industries/61
Singulariki. (2026). Educational Services. Singulariki: a source-backed encyclopedia of work. Retrieved June 7, 2026, from https://singulariki.com/industries/61
@misc{singulariki-61,
  title  = {Educational Services},
  author = {{Singulariki}},
  year   = {2026},
  note   = {O*NET 30.3; BLS Occupational Employment and Wage Statistics (OEWS) May 2024; Census NAICS 2022; Anthropic Economic Index v4 (2026-01-15) + v2 (2025-03-27); “GPTs are GPTs” (Eloundou et al.) arXiv 2303.10130; AI Occupational Exposure (AIOE) Felten, Raj & Seamans. Accessed June 7, 2026},
  url    = {https://singulariki.com/industries/61}
} Citations name the underlying public dataset releases — they reflect what this page is built from, not just the URL.