Farm and Garden Machinery and Equipment Merchant Wholesalers
National industry · NAICS 423820
A source-stamped Markdown brief of this occupation — paste it into an agent, or fetch
/industries/423820/context.md directly.
Farm and Garden Machinery and Equipment Merchant Wholesalers is a U.S. industry in the NAICS classification. The Bureau of Labor Statistics estimates about 114,070 workers across 111 detailed occupations in it. A typical worker earns around $59,199 a year (Singulariki estimate, see below).
This industry comprises establishments primarily engaged in the merchant wholesale distribution of specialized machinery, equipment, and related parts generally used in agricultural, farm, and lawn and garden activities. Illustrative Examples: Animal feeders merchant wholesalers Lawnmowers merchant wholesalers Milking machinery and equipment merchant wholesalers Harvesting machinery and equipment merchant wholesalers Planting machinery and equipment merchant wholesalers
Employment is national May 2024 OEWS. "Typical pay" is Singulariki's own figure — the employment-weighted average of each occupation's national median wage — a rough center of the industry, not an official BLS number.
How exposed this industry is to AI
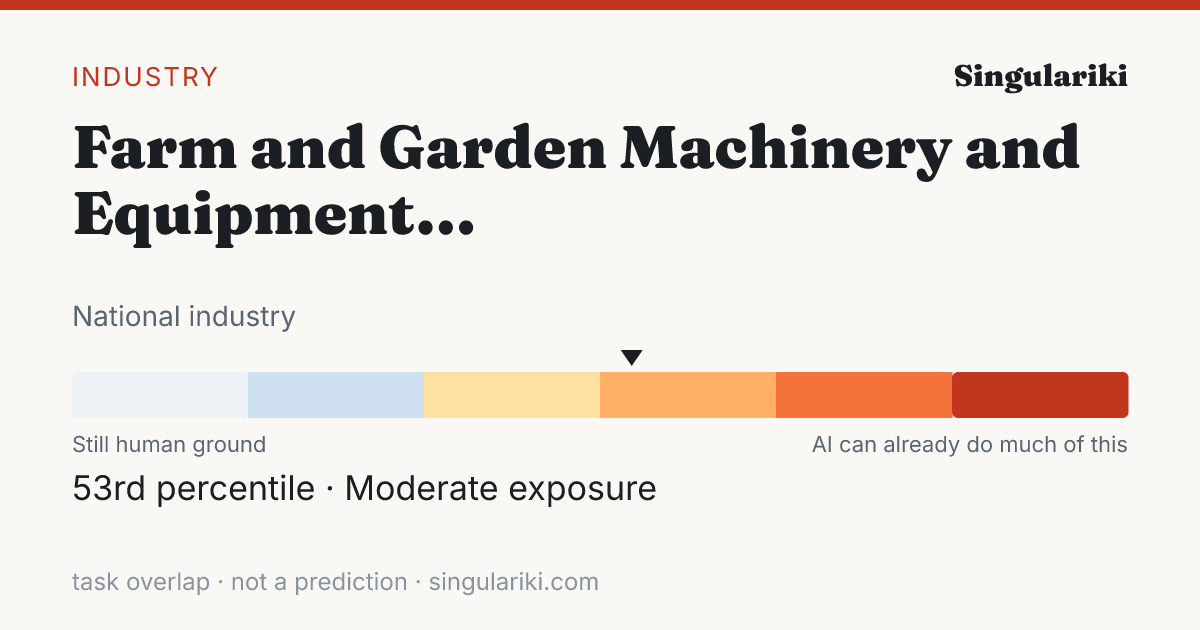
Weighting every occupation in this industry by its employment and its unified AI-exposure index (the OpenAI "GPTs are GPTs" human-rated task overlap folded with the Felten/Raj/Seamans AIOE index), this industry sits in the Moderate band — 53rd percentile across all industries.
Exposure measures how much of the work overlaps with what today's AI can do, not a prediction of automation; high-exposure industries are where AI is most likely to reshape tasks. Employment-weighted across 100 occupations that carry an exposure score. Compare every industry on the AI exposure hub.
How AI is actually used in this industry
Among measured Claude.ai (Free and Pro) conversations mapped to O*NET task statements (Anthropic Economic Index, 2026-01-15), these patterns are most associated with the occupations in this industry, weighted by its employment mix. They are shares of observed AI conversations — not of worker time, revenue, or what could be automated — and reflect one AI assistant's consumer sample, not all AI.
| Signal coverage | 61.8% of employment · 66/109 occupations have AEI task data |
| Augmentation vs. automation | 42.7% working with AI · 36.7% handed to AI |
| Most common pattern | Directive · AI does it; you give the instruction |
| Typical AI autonomy | 3.4 / 5 · higher = AI acts more independently |
Tasks driving the signal
The task families that account for the most AI activity across this industry's occupations (employment × observed usage), each attributed to the occupation it comes from.
| Task | Occupation | How | Share of signal |
|---|---|---|---|
| Troubleshoot problems involving office equipment, such as computer hardware and software. | Office Clerks, General | Feedback loop | 34.7% |
| Answer customers' questions about products, prices, availability, product uses, and credit terms. | Sales Representatives, Wholesale and Manufacturing, Except Technical and Scientific Products | Learning | 15.0% |
| Use computers for various applications, such as database management or word processing. | Secretaries and Administrative Assistants, Except Legal, Medical, and Executive | Directive | 3.3% |
| Conduct searches to find needed information, using such sources as the Internet. | Secretaries and Administrative Assistants, Except Legal, Medical, and Executive | Directive | 3.1% |
| Develop or maintain internal or external company Web sites. | Secretaries and Administrative Assistants, Except Legal, Medical, and Executive | Directive | 2.3% |
| Participate in the work of subordinates to facilitate productivity or to overcome difficult aspects of work. | First-Line Supervisors of Office and Administrative Support Workers | Iteration | 1.7% |
| Recommend, select, and help locate or obtain merchandise based on customer needs and desires. | Retail Salespersons | Iteration | 1.7% |
| Answer customers' questions about products, prices, availability, or credit terms. | Sales Representatives, Wholesale and Manufacturing, Technical and Scientific Products | Directive | 1.7% |
| Greet customers and ascertain what each customer wants or needs. | Retail Salespersons | none | 1.7% |
| Process and prepare documents, such as business or government forms and expense reports. | Office Clerks, General | Directive | 1.4% |
| Recommend products to customers, based on customers' needs and interests. | Sales Representatives, Wholesale and Manufacturing, Except Technical and Scientific Products | Iteration | 1.3% |
| Classify, record, and summarize numerical and financial data to compile and keep financial records, using journals and ledgers or computers. | Bookkeeping, Accounting, and Auditing Clerks | Directive | 1.0% |
Occupations behind the signal
The occupations whose AI-touched tasks contribute most to this industry's signal, by employment here.
| Occupation | Workers | Share | How they use AI |
|---|---|---|---|
| Sales Representatives, Wholesale and Manufacturing, Except Technical and Scientific Products | 13,640 | 12.0% | Directive |
| Parts Salespersons | 10,190 | 8.9% | Learning |
| General and Operations Managers | 5,420 | 4.8% | Iteration |
| First-Line Supervisors of Mechanics, Installers, and Repairers | 3,810 | 3.3% | Directive |
| Office Clerks, General | 3,490 | 3.1% | Feedback loop |
| Shipping, Receiving, and Inventory Clerks | 3,170 | 2.8% | Iteration |
| Bookkeeping, Accounting, and Auditing Clerks | 2,660 | 2.3% | Directive |
| Heavy and Tractor-Trailer Truck Drivers | 2,230 | 1.9% | Directive |
| Customer Service Representatives | 2,200 | 1.9% | Directive |
| First-Line Supervisors of Retail Sales Workers | 1,950 | 1.7% | Iteration |
| Retail Salespersons | 1,800 | 1.6% | none |
| Mobile Heavy Equipment Mechanics, Except Engines | 1,500 | 1.3% | Learning |
This rollup is only as complete as the occupation-task matches available for the industry; the coverage figure above is shown so sparse industries do not look falsely precise. AI exposure is not the same as replacement.
Skill & tool metabolism
What this industry's work actually runs on. Each figure is the share of the industry's workers in occupations that significantly rely on a skill, knowledge area, or ability (O*NET importance ≥ 3 of 5), or that use a tool category — its employment reach. This is a measure of how widespread a requirement is across the workforce, not how intensively any one worker uses it. Shares are independent and need not add to 100%.
Based on 96.7% of this industry's employment that maps to a detailed occupation with an O*NET skill profile.
Skills
| Skill | Employment reach | Workers |
|---|---|---|
| Active Listening | 92.4% | 105,410 |
| Critical Thinking | 88.8% | 101,270 |
| Speaking | 88.3% | 100,710 |
| Reading Comprehension | 87.7% | 100,040 |
| Time Management | 86.8% | 98,960 |
| Monitoring | 85.3% | 97,330 |
| Judgment and Decision Making | 69.8% | 79,580 |
| Complex Problem Solving | 62.4% | 71,160 |
| Active Learning | 59.5% | 67,870 |
| Writing | 56.8% | 64,780 |
| Social Perceptiveness | 51.9% | 59,240 |
| Service Orientation | 50.1% | 57,110 |
Knowledge areas
| Knowledge area | Employment reach | Workers |
|---|---|---|
| English Language | 92.7% | 105,700 |
| Customer and Personal Service | 89.2% | 101,790 |
| Mathematics | 74.9% | 85,410 |
| Computers and Electronics | 67.0% | 76,410 |
| Production and Processing | 46.6% | 53,180 |
| Administration and Management | 44.6% | 50,850 |
| Mechanical | 41.5% | 47,330 |
| Administrative | 40.0% | 45,600 |
| Sales and Marketing | 32.8% | 37,390 |
| Engineering and Technology | 26.4% | 30,150 |
| Personnel and Human Resources | 24.6% | 28,050 |
| Economics and Accounting | 23.9% | 27,290 |
Abilities
| Abilitie | Employment reach | Workers |
|---|---|---|
| Near Vision | 96.7% | 110,330 |
| Oral Comprehension | 95.8% | 109,320 |
| Oral Expression | 94.7% | 108,070 |
| Information Ordering | 94.1% | 107,330 |
| Problem Sensitivity | 91.3% | 104,090 |
| Speech Recognition | 89.5% | 102,040 |
| Written Comprehension | 88.3% | 100,740 |
| Speech Clarity | 87.7% | 100,060 |
| Deductive Reasoning | 86.8% | 99,020 |
| Category Flexibility | 84.3% | 96,200 |
| Inductive Reasoning | 82.9% | 94,550 |
| Written Expression | 80.3% | 91,610 |
Tool categories
| Tool category | Employment reach | Workers |
|---|---|---|
| Office suite software | 96.7% | 110,350 |
| Spreadsheet software | 96.7% | 110,350 |
| Electronic mail software | 94.7% | 108,080 |
| Word processing software | 93.4% | 106,570 |
| Data base user interface and query software | 86.1% | 98,230 |
| Internet browser software | 82.1% | 93,680 |
| Enterprise resource planning ERP software | 67.9% | 77,470 |
| Presentation software | 60.6% | 69,130 |
| Document management software | 56.0% | 63,930 |
| Operating system software | 55.0% | 62,700 |
| Customer relationship management CRM software | 49.2% | 56,130 |
| Accounting software | 45.5% | 51,860 |
| Project management software | 45.0% | 51,280 |
| Graphics or photo imaging software | 44.6% | 50,920 |
| Desktop publishing software | 41.8% | 47,670 |
Reach = share of industry employment in occupations where the requirement is significant; it is not a per-worker usage or proficiency measure. Skill, knowledge, and ability importance is from O*NET; tool use is reported presence of a technology category.
Largest occupations
The occupations that employ the most people in this industry, with their share of the industry's workforce and national median pay for the occupation (not industry-specific pay).
Showing the top 40 of 111 occupations by employment.
Most distinctive occupations
The occupations most unusually concentrated in this industry compared with the economy as a whole. The location quotient is how many times more common an occupation is here versus its economy-wide share (a value of 5 means five times as concentrated).
Write a report on thisheadline · factoids · citation
The Farm and Garden Machinery and Equipment Merchant Wholesalers workforce sits at the 53rd percentile of AI task overlap — 114,070 U.S. workers
- Weighting every occupation by its real share of Farm and Garden Machinery and Equipment Merchant Wholesalers employment, the industry's workforce ranks in the 53rd percentile (Moderate band) for AI task overlap — overlap with what AI can attempt, not a measure of jobs at risk.Eloundou et al. + Felten AIOE, weighted by BLS OEWS
- The industry employs about 114,070 U.S. workers across 111 occupations.BLS OEWS (May 2024)
- Employment-weighted typical annual pay is about $59,199.BLS OEWS (May 2024)
- Of AI use observed across this industry's occupations, 43% looks like augmentation rather than automation — from a Claude.ai sample, not a census.Anthropic Economic Index
The Farm and Garden Machinery and Equipment Merchant Wholesalers workforce sits at the 53rd percentile of AI task overlap — 114,070 U.S. workers

• Weighting every occupation by its real share of Farm and Garden Machinery and Equipment Merchant Wholesalers employment, the industry's workforce ranks in the 53rd percentile (Moderate band) for AI task overlap — overlap with what AI can attempt, not a measure of jobs at risk. (Eloundou et al. + Felten AIOE, weighted by BLS OEWS)
• The industry employs about 114,070 U.S. workers across 111 occupations. (BLS OEWS (May 2024))
• Employment-weighted typical annual pay is about $59,199. (BLS OEWS (May 2024))
• Of AI use observed across this industry's occupations, 43% looks like augmentation rather than automation — from a Claude.ai sample, not a census. (Anthropic Economic Index)

Source: Singulariki — "Farm and Garden Machinery and Equipment Merchant Wholesalers". https://singulariki.com/industries/423820
Note: AI task overlap measures what today's AI can attempt, not automation, job loss, or a forecast.
AssetsShare imageMethodology & sourcesPress & newsroomThe newsroom
Every line is built only from figures this page already shows and cites. AI task overlap means what today's AI can attempt — not automation, job loss, or a forecast.
Sources for this page
Every figure above traces to a named public dataset and the exact release below — not hand-written opinion. See the full methodology for what each measure does and does not mean.
- O*NET 30.3 U.S. Department of Labor / National Center for O*NET Development
- BLS Occupational Employment and Wage Statistics (OEWS) May 2024 U.S. Bureau of Labor Statistics
- Census NAICS 2022 U.S. Census Bureau
- Anthropic Economic Index v4 (2026-01-15) + v2 (2025-03-27) Anthropic
- “GPTs are GPTs” (Eloundou et al.) arXiv 2303.10130 OpenAI / academic
- AI Occupational Exposure (AIOE) Felten, Raj & Seamans academic
Data compiled June 3, 2026. Figures are estimates, not advice.
Cite this page
Singulariki. "Farm and Garden Machinery and Equipment Merchant Wholesalers." Singulariki: a source-backed encyclopedia of work. Built from O*NET 30.3; BLS Occupational Employment and Wage Statistics (OEWS) May 2024; Census NAICS 2022; Anthropic Economic Index v4 (2026-01-15) + v2 (2025-03-27); “GPTs are GPTs” (Eloundou et al.) arXiv 2303.10130; AI Occupational Exposure (AIOE) Felten, Raj & Seamans. Accessed June 7, 2026. https://singulariki.com/industries/423820
Singulariki. (2026). Farm and Garden Machinery and Equipment Merchant Wholesalers. Singulariki: a source-backed encyclopedia of work. Retrieved June 7, 2026, from https://singulariki.com/industries/423820
@misc{singulariki-423820,
  title  = {Farm and Garden Machinery and Equipment Merchant Wholesalers},
  author = {{Singulariki}},
  year   = {2026},
  note   = {O*NET 30.3; BLS Occupational Employment and Wage Statistics (OEWS) May 2024; Census NAICS 2022; Anthropic Economic Index v4 (2026-01-15) + v2 (2025-03-27); “GPTs are GPTs” (Eloundou et al.) arXiv 2303.10130; AI Occupational Exposure (AIOE) Felten, Raj & Seamans. Accessed June 7, 2026},
  url    = {https://singulariki.com/industries/423820}
} Citations name the underlying public dataset releases — they reflect what this page is built from, not just the URL.