Wholesale Trade
Sector · NAICS 42
A source-stamped Markdown brief of this occupation — paste it into an agent, or fetch
/industries/42/context.md directly.
Wholesale Trade is a U.S. industry in the NAICS classification. The Bureau of Labor Statistics estimates about 6,036,020 workers across 503 detailed occupations in it. A typical worker earns around $66,538 a year (Singulariki estimate, see below).
The Sector as a Whole The Wholesale Trade sector comprises establishments engaged in wholesaling merchandise, generally without transformation, and rendering services incidental to the sale of merchandise. The merchandise described in this sector includes the outputs of agriculture, mining, manufacturing, and certain information industries, such as publishing. The wholesaling process is an intermediate step in the distribution of merchandise. Wholesalers are organized to sell or arrange the purchase or sale of (a) goods for resale (i.e., goods sold to other wholesalers or retailers), (b) capital or durable nonconsumer goods, and (c) raw and intermediate materials and supplies used in production. Wholesalers sell merchandise to other businesses and normally operate from a warehouse or office. These warehouses and offices are characterized by having little or no display of merchandise. In addition, neither the design nor the location of the premises is intended to solicit walk-in traffic. Wholesalers do not normally use advertising directed to the general public. Customers are generally reached initially via telephone, in-person marketing, or by specialized advertising that may include Internet and other electronic means. Follow-up orders are either vendor-initiated or client-initiated, generally based on previous sales, and typically exhibit strong ties between sellers and buyers. In fact, transactions are often conducted between wholesalers and clients that have long-standing business relationships. This sector comprises two main types of wholesalers: merchant wholesalers that sell goods on their own account and agents and brokers that arrange sales and purchases for others generally for a commission or fee. (1) Establishments that sell goods on their own account are known as wholesale merchants, distributors, jobbers, drop shippers, and import/export merchants. Also included as wholesale merchants are sales offices and sales branches (but not retail stores) maintained by manufacturing, refining, or mining enterprises apart from their plants or mines for the purpose of marketing their products, and group purchasing organizations primarily purchasing and selling goods on their own account. Merchant wholesale establishments typically maintain their own warehouse, where they receive and handle goods for their customers. Goods are generally sold without transformation, but may include integral functions, such as sorting, packaging, labeling, and other marketing services. (2) Establishments arranging for the purchase or sale of goods owned by others or purchasing goods, generally on a commission basis are known as business-to-business electronic markets, agents and brokers, commission merchants, import/export agents and brokers, auction companies, group purchasing organizations (acting as agents), and manufacturers' representatives. These establishments operate from offices and generally do not own or handle the goods they sell. Some wholesale establishments may be connected with a single manufacturer and promote and sell the particular manufacturer's products to a wide range of other wholesalers or retailers. Other wholesalers may be connected to a retail chain, or limited number of retail chains, and only provide a variety of products needed by that particular retail operation(s). These wholesalers may obtain the products from a wide range of manufacturers. Still other wholesalers may not take title to the goods, but act as agents and brokers for a commission. Although, in general, wholesaling normally denotes sales in large volumes, durable nonconsumer goods may be sold in single units. Sales of capital or durable nonconsumer goods used in the production of goods and services, such as farm machinery, medium- and heavy-duty trucks, and industrial machinery, are always included in wholesale trade.
Employment is national May 2024 OEWS. "Typical pay" is Singulariki's own figure — the employment-weighted average of each occupation's national median wage — a rough center of the industry, not an official BLS number.
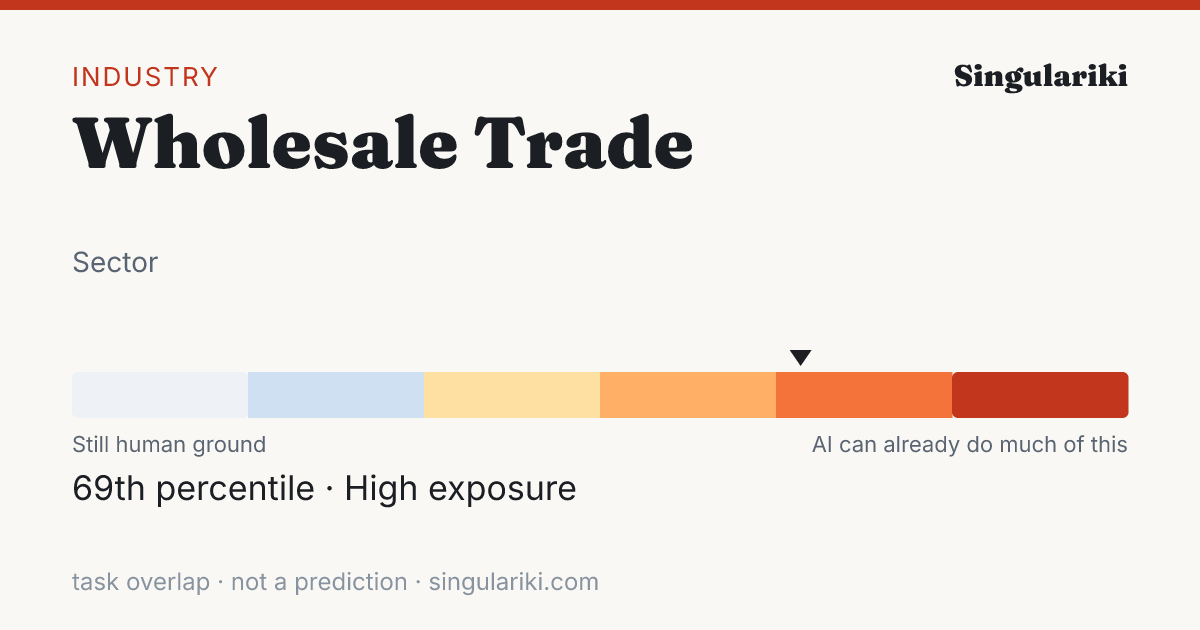
How exposed this industry is to AI
Weighting every occupation in this industry by its employment and its unified AI-exposure index (the OpenAI "GPTs are GPTs" human-rated task overlap folded with the Felten/Raj/Seamans AIOE index), this industry sits in the High band — 69th percentile across all industries.
Exposure measures how much of the work overlaps with what today's AI can do, not a prediction of automation; high-exposure industries are where AI is most likely to reshape tasks. Employment-weighted across 412 occupations that carry an exposure score. Compare every industry on the AI exposure hub.
How AI is actually used in this industry
Among measured Claude.ai (Free and Pro) conversations mapped to O*NET task statements (Anthropic Economic Index, 2026-01-15), these patterns are most associated with the occupations in this industry, weighted by its employment mix. They are shares of observed AI conversations — not of worker time, revenue, or what could be automated — and reflect one AI assistant's consumer sample, not all AI.
| Signal coverage | 66.7% of employment · 232/443 occupations have AEI task data |
| Augmentation vs. automation | 45.8% working with AI · 38.2% handed to AI |
| Most common pattern | Directive · AI does it; you give the instruction |
| Typical AI autonomy | 3.4 / 5 · higher = AI acts more independently |
Tasks driving the signal
The task families that account for the most AI activity across this industry's occupations (employment × observed usage), each attributed to the occupation it comes from.
| Task | Occupation | How | Share of signal |
|---|---|---|---|
| Troubleshoot problems involving office equipment, such as computer hardware and software. | Office Clerks, General | Feedback loop | 22.2% |
| Answer customers' questions about products, prices, availability, product uses, and credit terms. | Sales Representatives, Wholesale and Manufacturing, Except Technical and Scientific Products | Learning | 15.0% |
| Answer customers' questions about products, prices, availability, or credit terms. | Sales Representatives, Wholesale and Manufacturing, Technical and Scientific Products | Directive | 7.2% |
| Use computers for various applications, such as database management or word processing. | Secretaries and Administrative Assistants, Except Legal, Medical, and Executive | Directive | 2.4% |
| Conduct searches to find needed information, using such sources as the Internet. | Secretaries and Administrative Assistants, Except Legal, Medical, and Executive | Directive | 2.2% |
| Participate in the work of subordinates to facilitate productivity or to overcome difficult aspects of work. | First-Line Supervisors of Office and Administrative Support Workers | Iteration | 1.9% |
| Develop or maintain internal or external company Web sites. | Secretaries and Administrative Assistants, Except Legal, Medical, and Executive | Directive | 1.7% |
| Prepare sales presentations or proposals to explain product specifications or applications. | Sales Representatives, Wholesale and Manufacturing, Technical and Scientific Products | Iteration | 1.5% |
| Study documentation or other information for new scientific or technical products. | Sales Representatives, Wholesale and Manufacturing, Technical and Scientific Products | Directive | 1.4% |
| Answer customers' questions, and provide information on procedures or policies. | Cashiers | Directive | 1.4% |
| Recommend products to customers, based on customers' needs and interests. | Sales Representatives, Wholesale and Manufacturing, Except Technical and Scientific Products | Iteration | 1.3% |
| Provide information and advice to the public regarding the selection, purchase, and care of products. | Farmworkers and Laborers, Crop, Nursery, and Greenhouse | Directive | 1.1% |
Occupations behind the signal
The occupations whose AI-touched tasks contribute most to this industry's signal, by employment here.
| Occupation | Workers | Share | How they use AI |
|---|---|---|---|
| Sales Representatives, Wholesale and Manufacturing, Except Technical and Scientific Products | 808,710 | 13.4% | Directive |
| General and Operations Managers | 269,910 | 4.5% | Iteration |
| Heavy and Tractor-Trailer Truck Drivers | 268,970 | 4.5% | Directive |
| Customer Service Representatives | 172,500 | 2.9% | Directive |
| Sales Representatives, Wholesale and Manufacturing, Technical and Scientific Products | 171,180 | 2.8% | Directive |
| Shipping, Receiving, and Inventory Clerks | 135,030 | 2.2% | Iteration |
| Office Clerks, General | 132,290 | 2.2% | Feedback loop |
| Sales Managers | 123,910 | 2.1% | Iteration |
| Bookkeeping, Accounting, and Auditing Clerks | 116,260 | 1.9% | Directive |
| Driver/Sales Workers | 99,460 | 1.7% | none |
| First-Line Supervisors of Office and Administrative Support Workers | 70,310 | 1.2% | Iteration |
| Market Research Analysts and Marketing Specialists | 65,680 | 1.1% | Directive |
This rollup is only as complete as the occupation-task matches available for the industry; the coverage figure above is shown so sparse industries do not look falsely precise. AI exposure is not the same as replacement.
Skill & tool metabolism
What this industry's work actually runs on. Each figure is the share of the industry's workers in occupations that significantly rely on a skill, knowledge area, or ability (O*NET importance ≥ 3 of 5), or that use a tool category — its employment reach. This is a measure of how widespread a requirement is across the workforce, not how intensively any one worker uses it. Shares are independent and need not add to 100%.
Based on 93.3% of this industry's employment that maps to a detailed occupation with an O*NET skill profile.
Skills
| Skill | Employment reach | Workers |
|---|---|---|
| Active Listening | 84.7% | 5,111,150 |
| Reading Comprehension | 77.8% | 4,695,530 |
| Speaking | 77.2% | 4,660,220 |
| Critical Thinking | 76.7% | 4,630,630 |
| Time Management | 75.1% | 4,530,700 |
| Monitoring | 72.5% | 4,373,200 |
| Writing | 57.8% | 3,487,090 |
| Coordination | 55.5% | 3,347,730 |
| Complex Problem Solving | 55.1% | 3,325,710 |
| Judgment and Decision Making | 54.5% | 3,288,920 |
| Social Perceptiveness | 54.2% | 3,274,170 |
| Service Orientation | 49.9% | 3,013,070 |
Knowledge areas
| Knowledge area | Employment reach | Workers |
|---|---|---|
| English Language | 86.6% | 5,229,580 |
| Customer and Personal Service | 80.7% | 4,871,140 |
| Mathematics | 55.4% | 3,342,670 |
| Computers and Electronics | 51.5% | 3,110,020 |
| Administration and Management | 49.0% | 2,957,940 |
| Administrative | 32.9% | 1,986,100 |
| Sales and Marketing | 30.3% | 1,831,750 |
| Production and Processing | 27.0% | 1,630,620 |
| Transportation | 25.1% | 1,512,860 |
| Public Safety and Security | 21.4% | 1,290,800 |
| Education and Training | 20.9% | 1,258,770 |
| Economics and Accounting | 17.0% | 1,028,470 |
Abilities
| Abilitie | Employment reach | Workers |
|---|---|---|
| Near Vision | 93.3% | 5,629,240 |
| Oral Comprehension | 92.8% | 5,600,170 |
| Oral Expression | 91.3% | 5,510,540 |
| Information Ordering | 90.5% | 5,464,640 |
| Speech Recognition | 82.6% | 4,983,350 |
| Problem Sensitivity | 81.5% | 4,918,240 |
| Speech Clarity | 79.8% | 4,819,160 |
| Written Comprehension | 79.8% | 4,817,680 |
| Deductive Reasoning | 77.2% | 4,662,590 |
| Category Flexibility | 74.6% | 4,503,950 |
| Inductive Reasoning | 69.2% | 4,179,340 |
| Written Expression | 61.5% | 3,714,890 |
Tool categories
| Tool category | Employment reach | Workers |
|---|---|---|
| Spreadsheet software | 94.5% | 5,704,940 |
| Office suite software | 93.8% | 5,661,040 |
| Electronic mail software | 89.7% | 5,415,600 |
| Word processing software | 88.5% | 5,342,010 |
| Data base user interface and query software | 85.7% | 5,170,810 |
| Enterprise resource planning ERP software | 82.0% | 4,952,090 |
| Operating system software | 73.5% | 4,434,500 |
| Internet browser software | 67.7% | 4,084,990 |
| Presentation software | 65.8% | 3,973,710 |
| Document management software | 58.1% | 3,508,120 |
| Project management software | 55.2% | 3,330,480 |
| Desktop publishing software | 54.2% | 3,270,550 |
| Analytical or scientific software | 51.4% | 3,100,950 |
| Accounting software | 50.7% | 3,060,830 |
| Customer relationship management CRM software | 50.0% | 3,019,260 |
Reach = share of industry employment in occupations where the requirement is significant; it is not a per-worker usage or proficiency measure. Skill, knowledge, and ability importance is from O*NET; tool use is reported presence of a technology category.
Largest occupations
The occupations that employ the most people in this industry, with their share of the industry's workforce and national median pay for the occupation (not industry-specific pay).
Showing the top 40 of 503 occupations by employment.
Most distinctive occupations
The occupations most unusually concentrated in this industry compared with the economy as a whole. The location quotient is how many times more common an occupation is here versus its economy-wide share (a value of 5 means five times as concentrated).
For a sector this broad, the location quotient has a ceiling set by the sector's own share of national employment, so the top values tend to cluster near that limit.
Sub-industries
More detailed industries within Wholesale Trade.
Write a report on thisheadline · factoids · citation
The Wholesale Trade workforce sits at the 69th percentile of AI task overlap — 6,036,020 U.S. workers
- Weighting every occupation by its real share of Wholesale Trade employment, the industry's workforce ranks in the 69th percentile (High band) for AI task overlap — overlap with what AI can attempt, not a measure of jobs at risk.Eloundou et al. + Felten AIOE, weighted by BLS OEWS
- The industry employs about 6,036,020 U.S. workers across 503 occupations.BLS OEWS (May 2024)
- Employment-weighted typical annual pay is about $66,538.BLS OEWS (May 2024)
- Of AI use observed across this industry's occupations, 46% looks like augmentation rather than automation — from a Claude.ai sample, not a census.Anthropic Economic Index
The Wholesale Trade workforce sits at the 69th percentile of AI task overlap — 6,036,020 U.S. workers

• Weighting every occupation by its real share of Wholesale Trade employment, the industry's workforce ranks in the 69th percentile (High band) for AI task overlap — overlap with what AI can attempt, not a measure of jobs at risk. (Eloundou et al. + Felten AIOE, weighted by BLS OEWS)
• The industry employs about 6,036,020 U.S. workers across 503 occupations. (BLS OEWS (May 2024))
• Employment-weighted typical annual pay is about $66,538. (BLS OEWS (May 2024))
• Of AI use observed across this industry's occupations, 46% looks like augmentation rather than automation — from a Claude.ai sample, not a census. (Anthropic Economic Index)

Source: Singulariki — "Wholesale Trade". https://singulariki.com/industries/42
Note: AI task overlap measures what today's AI can attempt, not automation, job loss, or a forecast.
AssetsShare imageMethodology & sourcesPress & newsroomThe newsroom
Every line is built only from figures this page already shows and cites. AI task overlap means what today's AI can attempt — not automation, job loss, or a forecast.
Sources for this page
Every figure above traces to a named public dataset and the exact release below — not hand-written opinion. See the full methodology for what each measure does and does not mean.
- O*NET 30.3 U.S. Department of Labor / National Center for O*NET Development
- BLS Occupational Employment and Wage Statistics (OEWS) May 2024 U.S. Bureau of Labor Statistics
- Census NAICS 2022 U.S. Census Bureau
- Anthropic Economic Index v4 (2026-01-15) + v2 (2025-03-27) Anthropic
- “GPTs are GPTs” (Eloundou et al.) arXiv 2303.10130 OpenAI / academic
- AI Occupational Exposure (AIOE) Felten, Raj & Seamans academic
Data compiled June 3, 2026. Figures are estimates, not advice.
Cite this page
Singulariki. "Wholesale Trade." Singulariki: a source-backed encyclopedia of work. Built from O*NET 30.3; BLS Occupational Employment and Wage Statistics (OEWS) May 2024; Census NAICS 2022; Anthropic Economic Index v4 (2026-01-15) + v2 (2025-03-27); “GPTs are GPTs” (Eloundou et al.) arXiv 2303.10130; AI Occupational Exposure (AIOE) Felten, Raj & Seamans. Accessed June 7, 2026. https://singulariki.com/industries/42
Singulariki. (2026). Wholesale Trade. Singulariki: a source-backed encyclopedia of work. Retrieved June 7, 2026, from https://singulariki.com/industries/42
@misc{singulariki-42,
  title  = {Wholesale Trade},
  author = {{Singulariki}},
  year   = {2026},
  note   = {O*NET 30.3; BLS Occupational Employment and Wage Statistics (OEWS) May 2024; Census NAICS 2022; Anthropic Economic Index v4 (2026-01-15) + v2 (2025-03-27); “GPTs are GPTs” (Eloundou et al.) arXiv 2303.10130; AI Occupational Exposure (AIOE) Felten, Raj & Seamans. Accessed June 7, 2026},
  url    = {https://singulariki.com/industries/42}
} Citations name the underlying public dataset releases — they reflect what this page is built from, not just the URL.