Real Estate and Rental and Leasing
Sector · NAICS 53
A source-stamped Markdown brief of this occupation — paste it into an agent, or fetch
/industries/53/context.md directly.
Real Estate and Rental and Leasing is a U.S. industry in the NAICS classification. The Bureau of Labor Statistics estimates about 2,367,820 workers across 335 detailed occupations in it. A typical worker earns around $57,819 a year (Singulariki estimate, see below).
The Sector as a Whole The Real Estate and Rental and Leasing sector comprises establishments primarily engaged in renting, leasing, or otherwise allowing the use of tangible or intangible assets, and establishments providing related services. The major portion of this sector comprises establishments that rent, lease, or otherwise allow the use of their own assets by others. The assets may be tangible, as is the case of real estate and equipment, or intangible, as is the case with patents and trademarks. This sector also includes establishments primarily engaged in managing real estate for others, selling, renting, and/or buying real estate for others, and appraising real estate. These activities are closely related to this sector's main activity, and from a production basis they are included here. In addition, a substantial proportion of property management is self-performed by lessors. The main components of this sector are the real estate lessors industries (including equity real estate investment trusts (REITs)); equipment lessors industries (including motor vehicles, computers, and consumer goods); and lessors of nonfinancial intangible assets (except copyrighted works). Excluded from this sector are establishments primarily engaged in renting or leasing equipment with operators. Establishments renting or leasing equipment with operators are classified in various subsectors of NAICS depending on the nature of the services provided (e.g., transportation, construction, agriculture). These activities are excluded from this sector because the client is paying for the expertise and knowledge of the equipment operator, in addition to the rental of the equipment. In many cases, such as the rental of heavy construction equipment, the operator is essential to operate the equipment. Also excluded from this sector are mortgage REITs and establishments primarily engaged in managing the financial portfolio assets of REITs on a fee or commission basis. These establishments are classified in Sector 52, Finance and Insurance.
Employment is national May 2024 OEWS. "Typical pay" is Singulariki's own figure — the employment-weighted average of each occupation's national median wage — a rough center of the industry, not an official BLS number.
How exposed this industry is to AI
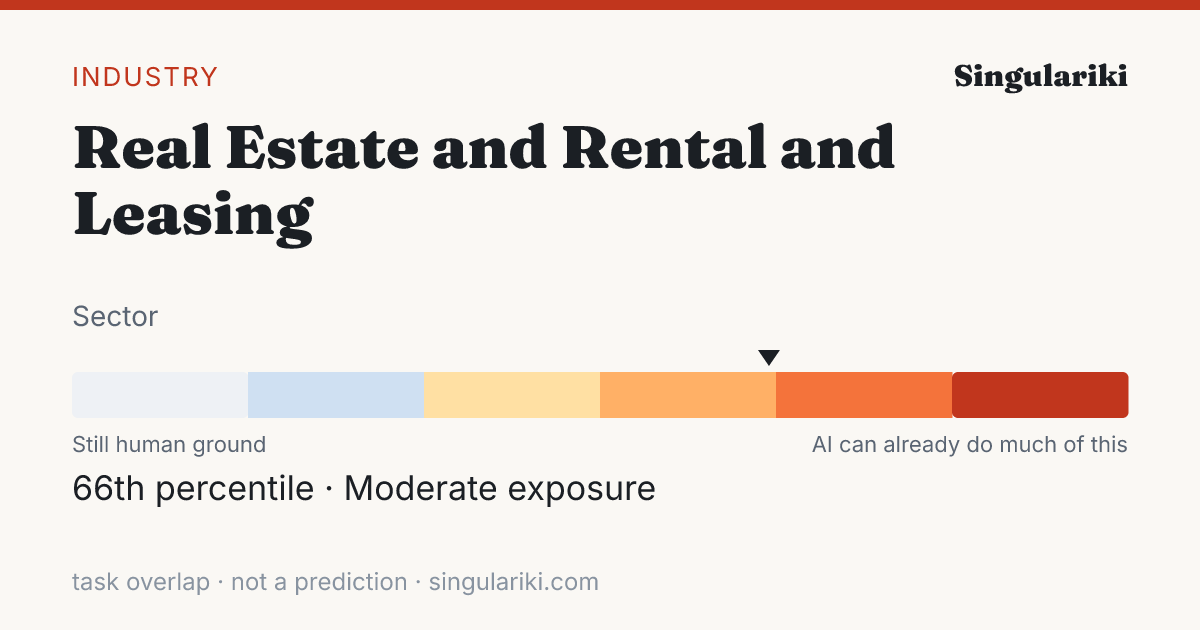
Weighting every occupation in this industry by its employment and its unified AI-exposure index (the OpenAI "GPTs are GPTs" human-rated task overlap folded with the Felten/Raj/Seamans AIOE index), this industry sits in the Moderate band — 66th percentile across all industries.
Exposure measures how much of the work overlaps with what today's AI can do, not a prediction of automation; high-exposure industries are where AI is most likely to reshape tasks. Employment-weighted across 256 occupations that carry an exposure score. Compare every industry on the AI exposure hub.
How AI is actually used in this industry
Among measured Claude.ai (Free and Pro) conversations mapped to O*NET task statements (Anthropic Economic Index, 2026-01-15), these patterns are most associated with the occupations in this industry, weighted by its employment mix. They are shares of observed AI conversations — not of worker time, revenue, or what could be automated — and reflect one AI assistant's consumer sample, not all AI.
| Signal coverage | 82.7% of employment · 162/277 occupations have AEI task data |
| Augmentation vs. automation | 45.9% working with AI · 36.3% handed to AI |
| Most common pattern | Directive · AI does it; you give the instruction |
| Typical AI autonomy | 3.4 / 5 · higher = AI acts more independently |
Tasks driving the signal
The task families that account for the most AI activity across this industry's occupations (employment × observed usage), each attributed to the occupation it comes from.
| Task | Occupation | How | Share of signal |
|---|---|---|---|
| Troubleshoot problems involving office equipment, such as computer hardware and software. | Office Clerks, General | Feedback loop | 34.4% |
| Advise clients on market conditions, prices, mortgages, legal requirements and related matters. | Real Estate Sales Agents | Learning | 5.5% |
| Use computers for various applications, such as database management or word processing. | Secretaries and Administrative Assistants, Except Legal, Medical, and Executive | Directive | 4.8% |
| Conduct searches to find needed information, using such sources as the Internet. | Secretaries and Administrative Assistants, Except Legal, Medical, and Executive | Directive | 4.4% |
| Recommend and provide advice on a wide variety of products and services. | Counter and Rental Clerks | Iteration | 3.5% |
| Develop or maintain internal or external company Web sites. | Secretaries and Administrative Assistants, Except Legal, Medical, and Executive | Directive | 3.3% |
| Promote sales of properties through advertisements, open houses, and participation in multiple listing services. | Real Estate Sales Agents | Iteration | 1.8% |
| Explain rental fees, policies, and procedures. | Counter and Rental Clerks | Learning | 1.4% |
| Participate in the work of subordinates to facilitate productivity or to overcome difficult aspects of work. | First-Line Supervisors of Office and Administrative Support Workers | Iteration | 1.4% |
| Process and prepare documents, such as business or government forms and expense reports. | Office Clerks, General | Directive | 1.4% |
| Manage and oversee operations, maintenance, administration, and improvement of commercial, industrial, or residential properties. | Property, Real Estate, and Community Association Managers | Iteration | 1.2% |
| Evaluate mortgage options to help clients obtain financing at the best prevailing rates and terms. | Real Estate Sales Agents | Learning | 1.1% |
Occupations behind the signal
The occupations whose AI-touched tasks contribute most to this industry's signal, by employment here.
| Occupation | Workers | Share | How they use AI |
|---|---|---|---|
| Maintenance and Repair Workers, General | 314,320 | 13.3% | Learning |
| Property, Real Estate, and Community Association Managers | 239,020 | 10.1% | Iteration |
| Counter and Rental Clerks | 189,840 | 8.0% | Directive |
| Real Estate Sales Agents | 154,000 | 6.5% | Iteration |
| General and Operations Managers | 106,570 | 4.5% | Iteration |
| Office Clerks, General | 100,870 | 4.3% | Feedback loop |
| Secretaries and Administrative Assistants, Except Legal, Medical, and Executive | 61,960 | 2.6% | Directive |
| Bookkeeping, Accounting, and Auditing Clerks | 61,750 | 2.6% | Directive |
| First-Line Supervisors of Mechanics, Installers, and Repairers | 58,270 | 2.5% | Directive |
| Accountants and Auditors | 50,410 | 2.1% | Directive |
| Real Estate Brokers | 43,010 | 1.8% | Directive |
| Customer Service Representatives | 41,740 | 1.8% | Directive |
This rollup is only as complete as the occupation-task matches available for the industry; the coverage figure above is shown so sparse industries do not look falsely precise. AI exposure is not the same as replacement.
Skill & tool metabolism
What this industry's work actually runs on. Each figure is the share of the industry's workers in occupations that significantly rely on a skill, knowledge area, or ability (O*NET importance ≥ 3 of 5), or that use a tool category — its employment reach. This is a measure of how widespread a requirement is across the workforce, not how intensively any one worker uses it. Shares are independent and need not add to 100%.
Based on 95.8% of this industry's employment that maps to a detailed occupation with an O*NET skill profile.
Skills
| Skill | Employment reach | Workers |
|---|---|---|
| Active Listening | 90.8% | 2,151,070 |
| Speaking | 89.4% | 2,116,090 |
| Critical Thinking | 85.8% | 2,031,240 |
| Reading Comprehension | 83.9% | 1,987,630 |
| Time Management | 83.6% | 1,979,710 |
| Monitoring | 79.7% | 1,888,030 |
| Coordination | 76.0% | 1,798,460 |
| Writing | 64.7% | 1,532,450 |
| Judgment and Decision Making | 63.4% | 1,500,500 |
| Social Perceptiveness | 63.2% | 1,495,350 |
| Service Orientation | 61.7% | 1,461,460 |
| Complex Problem Solving | 60.7% | 1,438,390 |
Knowledge areas
| Knowledge area | Employment reach | Workers |
|---|---|---|
| English Language | 90.3% | 2,137,590 |
| Customer and Personal Service | 77.1% | 1,824,450 |
| Administration and Management | 66.5% | 1,574,740 |
| Mathematics | 66.0% | 1,563,750 |
| Administrative | 59.8% | 1,415,840 |
| Computers and Electronics | 46.5% | 1,099,950 |
| Building and Construction | 34.3% | 811,100 |
| Sales and Marketing | 34.3% | 812,710 |
| Economics and Accounting | 33.8% | 800,660 |
| Education and Training | 30.4% | 719,850 |
| Law and Government | 28.1% | 666,010 |
| Public Safety and Security | 27.1% | 640,650 |
Abilities
| Abilitie | Employment reach | Workers |
|---|---|---|
| Near Vision | 95.7% | 2,266,940 |
| Oral Comprehension | 93.3% | 2,209,520 |
| Oral Expression | 93.3% | 2,208,960 |
| Problem Sensitivity | 91.3% | 2,160,710 |
| Information Ordering | 87.5% | 2,072,200 |
| Speech Recognition | 86.8% | 2,056,310 |
| Speech Clarity | 85.9% | 2,033,090 |
| Written Comprehension | 85.0% | 2,011,710 |
| Written Expression | 78.4% | 1,857,050 |
| Deductive Reasoning | 76.9% | 1,822,030 |
| Inductive Reasoning | 74.5% | 1,764,910 |
| Category Flexibility | 70.3% | 1,663,470 |
Tool categories
| Tool category | Employment reach | Workers |
|---|---|---|
| Spreadsheet software | 96.5% | 2,284,940 |
| Office suite software | 95.1% | 2,251,100 |
| Electronic mail software | 94.6% | 2,239,550 |
| Word processing software | 93.5% | 2,213,150 |
| Data base user interface and query software | 88.3% | 2,090,610 |
| Presentation software | 81.0% | 1,917,310 |
| Operating system software | 69.0% | 1,633,360 |
| Project management software | 67.2% | 1,590,560 |
| Enterprise resource planning ERP software | 65.4% | 1,548,500 |
| Internet browser software | 63.5% | 1,502,660 |
| Web page creation and editing software | 60.0% | 1,420,100 |
| Cloud-based data access and sharing software | 58.9% | 1,394,940 |
| Accounting software | 53.7% | 1,270,600 |
| Video creation and editing software | 52.4% | 1,239,710 |
| Desktop publishing software | 50.1% | 1,186,410 |
Reach = share of industry employment in occupations where the requirement is significant; it is not a per-worker usage or proficiency measure. Skill, knowledge, and ability importance is from O*NET; tool use is reported presence of a technology category.
Largest occupations
The occupations that employ the most people in this industry, with their share of the industry's workforce and national median pay for the occupation (not industry-specific pay).
Showing the top 40 of 335 occupations by employment.
Most distinctive occupations
The occupations most unusually concentrated in this industry compared with the economy as a whole. The location quotient is how many times more common an occupation is here versus its economy-wide share (a value of 5 means five times as concentrated).
For a sector this broad, the location quotient has a ceiling set by the sector's own share of national employment, so the top values tend to cluster near that limit.
| Occupation | Concentration | Workers |
|---|---|---|
| Real Estate Brokers | 56.48× | 43,010 |
| Real Estate Sales Agents | 52.61× | 154,000 |
| Property, Real Estate, and Community Association Managers | 52.47× | 239,020 |
| Counter and Rental Clerks | 31.01× | 189,840 |
| Property Appraisers and Assessors | 16.41× | 14,890 |
| Maintenance and Repair Workers, General | 13.36× | 314,320 |
| Concierges | 13.14× | 8,920 |
| Audio and Video Technicians | 12.37× | 13,310 |
| Correspondence Clerks | 9.99× | 960 |
| Material Moving Workers, All Other | 9.38× | 3,630 |
| Motor Vehicle Operators, All Other | 7.72× | 5,970 |
| Mobile Heavy Equipment Mechanics, Except Engines | 7.52× | 20,820 |
| Medical Equipment Repairers | 6.59× | 6,160 |
| First-Line Supervisors of Mechanics, Installers, and Repairers | 6.32× | 58,270 |
| Cleaners of Vehicles and Equipment | 4.59× | 26,370 |
| Bicycle Repairers | 4.45× | 860 |
| Lighting Technicians | 4.37× | 680 |
| Title Examiners, Abstractors, and Searchers | 4.15× | 3,070 |
| Recreational Vehicle Service Technicians | 3.65× | 1,050 |
| Baggage Porters and Bellhops | 3.59× | 1,720 |
Write a report on thisheadline · factoids · citation
The Real Estate and Rental and Leasing workforce sits at the 66th percentile of AI task overlap — 2,367,820 U.S. workers
- Weighting every occupation by its real share of Real Estate and Rental and Leasing employment, the industry's workforce ranks in the 66th percentile (Moderate band) for AI task overlap — overlap with what AI can attempt, not a measure of jobs at risk.Eloundou et al. + Felten AIOE, weighted by BLS OEWS
- The industry employs about 2,367,820 U.S. workers across 335 occupations.BLS OEWS (May 2024)
- Employment-weighted typical annual pay is about $57,819.BLS OEWS (May 2024)
- Of AI use observed across this industry's occupations, 46% looks like augmentation rather than automation — from a Claude.ai sample, not a census.Anthropic Economic Index
The Real Estate and Rental and Leasing workforce sits at the 66th percentile of AI task overlap — 2,367,820 U.S. workers

• Weighting every occupation by its real share of Real Estate and Rental and Leasing employment, the industry's workforce ranks in the 66th percentile (Moderate band) for AI task overlap — overlap with what AI can attempt, not a measure of jobs at risk. (Eloundou et al. + Felten AIOE, weighted by BLS OEWS)
• The industry employs about 2,367,820 U.S. workers across 335 occupations. (BLS OEWS (May 2024))
• Employment-weighted typical annual pay is about $57,819. (BLS OEWS (May 2024))
• Of AI use observed across this industry's occupations, 46% looks like augmentation rather than automation — from a Claude.ai sample, not a census. (Anthropic Economic Index)

Source: Singulariki — "Real Estate and Rental and Leasing". https://singulariki.com/industries/53
Note: AI task overlap measures what today's AI can attempt, not automation, job loss, or a forecast.
AssetsShare imageMethodology & sourcesPress & newsroomThe newsroom
Every line is built only from figures this page already shows and cites. AI task overlap means what today's AI can attempt — not automation, job loss, or a forecast.
Sources for this page
Every figure above traces to a named public dataset and the exact release below — not hand-written opinion. See the full methodology for what each measure does and does not mean.
- O*NET 30.3 U.S. Department of Labor / National Center for O*NET Development
- BLS Occupational Employment and Wage Statistics (OEWS) May 2024 U.S. Bureau of Labor Statistics
- Census NAICS 2022 U.S. Census Bureau
- Anthropic Economic Index v4 (2026-01-15) + v2 (2025-03-27) Anthropic
- “GPTs are GPTs” (Eloundou et al.) arXiv 2303.10130 OpenAI / academic
- AI Occupational Exposure (AIOE) Felten, Raj & Seamans academic
Data compiled June 3, 2026. Figures are estimates, not advice.
Cite this page
Singulariki. "Real Estate and Rental and Leasing." Singulariki: a source-backed encyclopedia of work. Built from O*NET 30.3; BLS Occupational Employment and Wage Statistics (OEWS) May 2024; Census NAICS 2022; Anthropic Economic Index v4 (2026-01-15) + v2 (2025-03-27); “GPTs are GPTs” (Eloundou et al.) arXiv 2303.10130; AI Occupational Exposure (AIOE) Felten, Raj & Seamans. Accessed June 7, 2026. https://singulariki.com/industries/53
Singulariki. (2026). Real Estate and Rental and Leasing. Singulariki: a source-backed encyclopedia of work. Retrieved June 7, 2026, from https://singulariki.com/industries/53
@misc{singulariki-53,
  title  = {Real Estate and Rental and Leasing},
  author = {{Singulariki}},
  year   = {2026},
  note   = {O*NET 30.3; BLS Occupational Employment and Wage Statistics (OEWS) May 2024; Census NAICS 2022; Anthropic Economic Index v4 (2026-01-15) + v2 (2025-03-27); “GPTs are GPTs” (Eloundou et al.) arXiv 2303.10130; AI Occupational Exposure (AIOE) Felten, Raj & Seamans. Accessed June 7, 2026},
  url    = {https://singulariki.com/industries/53}
} Citations name the underlying public dataset releases — they reflect what this page is built from, not just the URL.