Research and Development in the Social Sciences and Humanities
National industry · NAICS 541720
A source-stamped Markdown brief of this occupation — paste it into an agent, or fetch
/industries/541720/context.md directly.
Research and Development in the Social Sciences and Humanities is a U.S. industry in the NAICS classification. The Bureau of Labor Statistics estimates about 60,790 workers across 124 detailed occupations in it. A typical worker earns around $86,127 a year (Singulariki estimate, see below).
This industry comprises establishments primarily engaged in conducting research and analyses in cognitive development, sociology, psychology, language, behavior, economic, and other social science and humanities research. Cross-References. Establishments primarily engaged in--
Employment is national May 2024 OEWS. "Typical pay" is Singulariki's own figure — the employment-weighted average of each occupation's national median wage — a rough center of the industry, not an official BLS number.
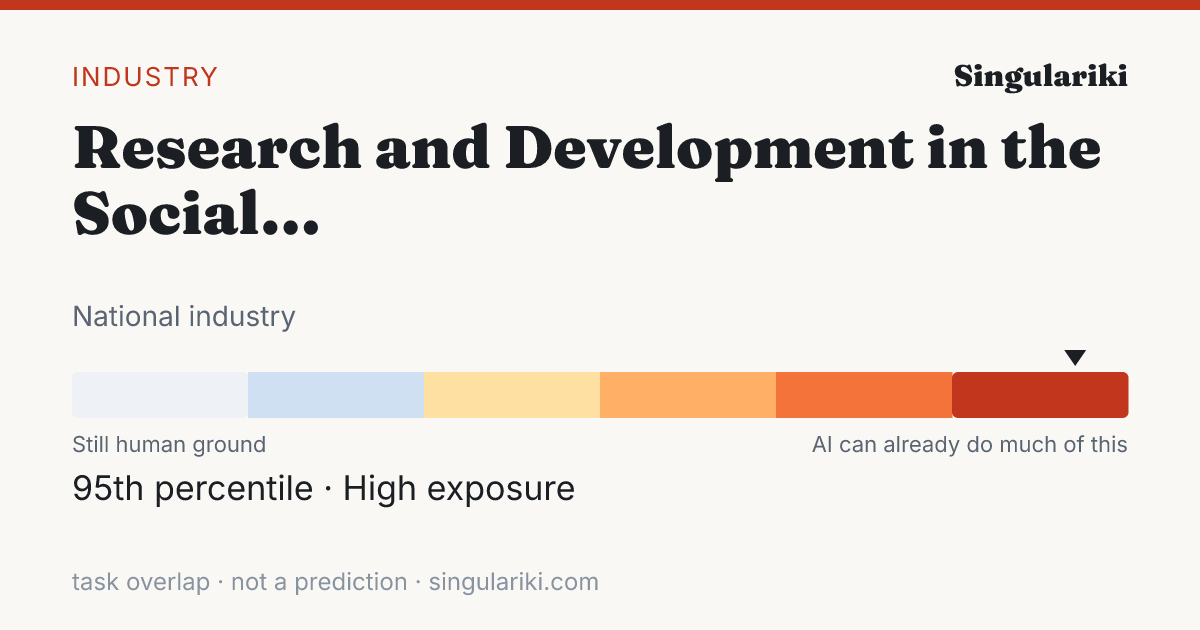
How exposed this industry is to AI
Weighting every occupation in this industry by its employment and its unified AI-exposure index (the OpenAI "GPTs are GPTs" human-rated task overlap folded with the Felten/Raj/Seamans AIOE index), this industry sits in the High band — 95th percentile across all industries.
Exposure measures how much of the work overlaps with what today's AI can do, not a prediction of automation; high-exposure industries are where AI is most likely to reshape tasks. Employment-weighted across 107 occupations that carry an exposure score. Compare every industry on the AI exposure hub.
How AI is actually used in this industry
Among measured Claude.ai (Free and Pro) conversations mapped to O*NET task statements (Anthropic Economic Index, 2026-01-15), these patterns are most associated with the occupations in this industry, weighted by its employment mix. They are shares of observed AI conversations — not of worker time, revenue, or what could be automated — and reflect one AI assistant's consumer sample, not all AI.
| Signal coverage | 80.8% of employment · 79/114 occupations have AEI task data |
| Augmentation vs. automation | 50.4% working with AI · 39.0% handed to AI |
| Most common pattern | Directive · AI does it; you give the instruction |
| Typical AI autonomy | 3.7 / 5 · higher = AI acts more independently |
Tasks driving the signal
The task families that account for the most AI activity across this industry's occupations (employment × observed usage), each attributed to the occupation it comes from.
| Task | Occupation | How | Share of signal |
|---|---|---|---|
| Troubleshoot problems involving office equipment, such as computer hardware and software. | Office Clerks, General | Feedback loop | 19.3% |
| Review class material with students by discussing text, working solutions to problems, or reviewing worksheets or other assignments. | Teachers and Instructors, All Other | Directive | 7.5% |
| Provide private instruction to individual or small groups of students to improve academic performance, improve occupational skills, or prepare for academic or occupational tests. | Teachers and Instructors, All Other | Learning | 5.3% |
| Prepare, rewrite and edit copy to improve readability, or supervise others who do this work. | Editors | Iteration | 5.3% |
| Conduct internet-based and library research. | Social Science Research Assistants | Directive | 4.0% |
| Instruct individuals in career development techniques such as job search and application strategies, resume writing, and interview skills. | Educational, Guidance, and Career Counselors and Advisors | Iteration | 3.5% |
| Research, compile, analyze and organize information from maps, reports, investigations, and books for use in reports and special projects. | Social Science Research Assistants | Directive | 2.5% |
| Use computers for various applications, such as database management or word processing. | Secretaries and Administrative Assistants, Except Legal, Medical, and Executive | Directive | 2.2% |
| Prepare tables, graphs, fact sheets, and written reports summarizing research results. | Social Science Research Assistants | Directive | 2.2% |
| Conduct searches to find needed information, using such sources as the Internet. | Secretaries and Administrative Assistants, Except Legal, Medical, and Executive | Directive | 2.1% |
| Develop teaching or training materials, such as handouts, study materials, or quizzes. | Teachers and Instructors, All Other | Iteration | 1.6% |
| Prepare, manipulate, and manage extensive databases. | Social Science Research Assistants | Directive | 1.6% |
Occupations behind the signal
The occupations whose AI-touched tasks contribute most to this industry's signal, by employment here.
| Occupation | Workers | Share | How they use AI |
|---|---|---|---|
| Social Science Research Assistants | 6,450 | 10.6% | Directive |
| General and Operations Managers | 3,810 | 6.3% | Iteration |
| Office Clerks, General | 3,360 | 5.5% | Feedback loop |
| Social Scientists and Related Workers, All Other | 2,450 | 4.0% | Directive |
| Mental Health and Substance Abuse Social Workers | 2,120 | 3.5% | Learning |
| Anthropologists and Archeologists | 1,810 | 3.0% | Learning |
| Business Operations Specialists, All Other | 1,800 | 3.0% | Directive |
| Secretaries and Administrative Assistants, Except Legal, Medical, and Executive | 1,730 | 2.9% | Directive |
| Managers, All Other | 1,510 | 2.5% | Directive |
| Operations Research Analysts | 1,300 | 2.1% | Iteration |
| Economists | 1,200 | 2.0% | Learning |
| Public Relations Specialists | 1,170 | 1.9% | Iteration |
This rollup is only as complete as the occupation-task matches available for the industry; the coverage figure above is shown so sparse industries do not look falsely precise. AI exposure is not the same as replacement.
Skill & tool metabolism
What this industry's work actually runs on. Each figure is the share of the industry's workers in occupations that significantly rely on a skill, knowledge area, or ability (O*NET importance ≥ 3 of 5), or that use a tool category — its employment reach. This is a measure of how widespread a requirement is across the workforce, not how intensively any one worker uses it. Shares are independent and need not add to 100%.
Based on 89.5% of this industry's employment that maps to a detailed occupation with an O*NET skill profile.
Skills
| Skill | Employment reach | Workers |
|---|---|---|
| Active Listening | 89.5% | 54,420 |
| Speaking | 89.4% | 54,340 |
| Reading Comprehension | 89.0% | 54,120 |
| Critical Thinking | 88.9% | 54,040 |
| Writing | 88.7% | 53,950 |
| Judgment and Decision Making | 80.7% | 49,030 |
| Complex Problem Solving | 78.1% | 47,470 |
| Active Learning | 78.0% | 47,390 |
| Time Management | 75.0% | 45,600 |
| Coordination | 74.0% | 44,970 |
| Systems Analysis | 72.3% | 43,940 |
| Social Perceptiveness | 70.0% | 42,560 |
Knowledge areas
| Knowledge area | Employment reach | Workers |
|---|---|---|
| English Language | 89.0% | 54,120 |
| Customer and Personal Service | 74.3% | 45,190 |
| Computers and Electronics | 67.4% | 41,000 |
| Mathematics | 56.9% | 34,580 |
| Administration and Management | 54.2% | 32,970 |
| Administrative | 46.9% | 28,540 |
| Education and Training | 32.4% | 19,680 |
| Communications and Media | 20.9% | 12,730 |
| Law and Government | 17.8% | 10,800 |
| Economics and Accounting | 16.4% | 9,970 |
| Personnel and Human Resources | 15.9% | 9,680 |
| Psychology | 15.7% | 9,550 |
Abilities
| Abilitie | Employment reach | Workers |
|---|---|---|
| Near Vision | 89.5% | 54,420 |
| Oral Comprehension | 89.5% | 54,420 |
| Oral Expression | 89.5% | 54,420 |
| Problem Sensitivity | 89.2% | 54,220 |
| Speech Clarity | 89.0% | 54,120 |
| Speech Recognition | 89.0% | 54,120 |
| Written Comprehension | 89.0% | 54,120 |
| Information Ordering | 88.9% | 54,060 |
| Written Expression | 88.9% | 54,070 |
| Deductive Reasoning | 88.8% | 53,980 |
| Inductive Reasoning | 88.8% | 54,010 |
| Category Flexibility | 88.3% | 53,660 |
Tool categories
| Tool category | Employment reach | Workers |
|---|---|---|
| Office suite software | 94.5% | 57,420 |
| Spreadsheet software | 94.5% | 57,420 |
| Presentation software | 94.0% | 57,120 |
| Word processing software | 93.8% | 57,010 |
| Electronic mail software | 93.3% | 56,700 |
| Data base user interface and query software | 93.2% | 56,640 |
| Desktop publishing software | 81.0% | 49,220 |
| Project management software | 79.9% | 48,570 |
| Internet browser software | 78.2% | 47,530 |
| Analytical or scientific software | 76.7% | 46,620 |
| Document management software | 74.1% | 45,020 |
| Graphics or photo imaging software | 71.3% | 43,370 |
| Enterprise resource planning ERP software | 66.8% | 40,610 |
| Development environment software | 65.6% | 39,850 |
| Operating system software | 62.6% | 38,060 |
Reach = share of industry employment in occupations where the requirement is significant; it is not a per-worker usage or proficiency measure. Skill, knowledge, and ability importance is from O*NET; tool use is reported presence of a technology category.
Largest occupations
The occupations that employ the most people in this industry, with their share of the industry's workforce and national median pay for the occupation (not industry-specific pay).
Showing the top 40 of 124 occupations by employment.
Most distinctive occupations
The occupations most unusually concentrated in this industry compared with the economy as a whole. The location quotient is how many times more common an occupation is here versus its economy-wide share (a value of 5 means five times as concentrated).
| Occupation | Concentration | Workers |
|---|---|---|
| Sociologists | 971.56× | 1,130 |
| Anthropologists and Archeologists | 568.88× | 1,810 |
| Social Science Research Assistants | 496.65× | 6,450 |
| Industrial-Organizational Psychologists | 410.65× | 170 |
| Political Scientists | 260.03× | 610 |
| Economists | 191.67× | 1,200 |
| Historians | 185.79× | 230 |
| Social Scientists and Related Workers, All Other | 168.09× | 2,450 |
| Archivists | 43.17× | 120 |
| Mental Health and Substance Abuse Social Workers | 42.71× | 2,120 |
| Statisticians | 34.05× | 400 |
| Operations Research Analysts | 30.6× | 1,300 |
| Teachers and Instructors, All Other | 20.49× | 1,010 |
| Editors | 20.45× | 770 |
| Life, Physical, and Social Science Technicians, All Other | 20.25× | 570 |
| Psychologists, All Other | 19.96× | 140 |
| Natural Sciences Managers | 18.1× | 720 |
| Clinical and Counseling Psychologists | 16.86× | 480 |
| Interviewers, Except Eligibility and Loan | 12.25× | 760 |
| Public Relations Specialists | 10.58× | 1,170 |
Write a report on thisheadline · factoids · citation
The Research and Development in the Social Sciences and Humanities workforce sits at the 95th percentile of AI task overlap — 60,790 U.S. workers
- Weighting every occupation by its real share of Research and Development in the Social Sciences and Humanities employment, the industry's workforce ranks in the 95th percentile (High band) for AI task overlap — overlap with what AI can attempt, not a measure of jobs at risk.Eloundou et al. + Felten AIOE, weighted by BLS OEWS
- The industry employs about 60,790 U.S. workers across 124 occupations.BLS OEWS (May 2024)
- Employment-weighted typical annual pay is about $86,127.BLS OEWS (May 2024)
- Of AI use observed across this industry's occupations, 50% looks like augmentation rather than automation — from a Claude.ai sample, not a census.Anthropic Economic Index
The Research and Development in the Social Sciences and Humanities workforce sits at the 95th percentile of AI task overlap — 60,790 U.S. workers

• Weighting every occupation by its real share of Research and Development in the Social Sciences and Humanities employment, the industry's workforce ranks in the 95th percentile (High band) for AI task overlap — overlap with what AI can attempt, not a measure of jobs at risk. (Eloundou et al. + Felten AIOE, weighted by BLS OEWS)
• The industry employs about 60,790 U.S. workers across 124 occupations. (BLS OEWS (May 2024))
• Employment-weighted typical annual pay is about $86,127. (BLS OEWS (May 2024))
• Of AI use observed across this industry's occupations, 50% looks like augmentation rather than automation — from a Claude.ai sample, not a census. (Anthropic Economic Index)

Source: Singulariki — "Research and Development in the Social Sciences and Humanities". https://singulariki.com/industries/541720
Note: AI task overlap measures what today's AI can attempt, not automation, job loss, or a forecast.
AssetsShare imageMethodology & sourcesPress & newsroomThe newsroom
Every line is built only from figures this page already shows and cites. AI task overlap means what today's AI can attempt — not automation, job loss, or a forecast.
Sources for this page
Every figure above traces to a named public dataset and the exact release below — not hand-written opinion. See the full methodology for what each measure does and does not mean.
- O*NET 30.3 U.S. Department of Labor / National Center for O*NET Development
- BLS Occupational Employment and Wage Statistics (OEWS) May 2024 U.S. Bureau of Labor Statistics
- Census NAICS 2022 U.S. Census Bureau
- Anthropic Economic Index v4 (2026-01-15) + v2 (2025-03-27) Anthropic
- “GPTs are GPTs” (Eloundou et al.) arXiv 2303.10130 OpenAI / academic
- AI Occupational Exposure (AIOE) Felten, Raj & Seamans academic
Data compiled June 3, 2026. Figures are estimates, not advice.
Cite this page
Singulariki. "Research and Development in the Social Sciences and Humanities." Singulariki: a source-backed encyclopedia of work. Built from O*NET 30.3; BLS Occupational Employment and Wage Statistics (OEWS) May 2024; Census NAICS 2022; Anthropic Economic Index v4 (2026-01-15) + v2 (2025-03-27); “GPTs are GPTs” (Eloundou et al.) arXiv 2303.10130; AI Occupational Exposure (AIOE) Felten, Raj & Seamans. Accessed June 7, 2026. https://singulariki.com/industries/541720
Singulariki. (2026). Research and Development in the Social Sciences and Humanities. Singulariki: a source-backed encyclopedia of work. Retrieved June 7, 2026, from https://singulariki.com/industries/541720
@misc{singulariki-541720,
  title  = {Research and Development in the Social Sciences and Humanities},
  author = {{Singulariki}},
  year   = {2026},
  note   = {O*NET 30.3; BLS Occupational Employment and Wage Statistics (OEWS) May 2024; Census NAICS 2022; Anthropic Economic Index v4 (2026-01-15) + v2 (2025-03-27); “GPTs are GPTs” (Eloundou et al.) arXiv 2303.10130; AI Occupational Exposure (AIOE) Felten, Raj & Seamans. Accessed June 7, 2026},
  url    = {https://singulariki.com/industries/541720}
} Citations name the underlying public dataset releases — they reflect what this page is built from, not just the URL.