Professional, Scientific, and Technical Services
Sector · NAICS 54
A source-stamped Markdown brief of this occupation — paste it into an agent, or fetch
/industries/54/context.md directly.
Professional, Scientific, and Technical Services is a U.S. industry in the NAICS classification. The Bureau of Labor Statistics estimates about 10,769,430 workers across 573 detailed occupations in it. A typical worker earns around $94,982 a year (Singulariki estimate, see below).
The Sector as a Whole The Professional, Scientific, and Technical Services sector comprises establishments that specialize in performing professional, scientific, and technical activities for others. These activities require a high degree of expertise and training. The establishments in this sector specialize according to expertise and provide these services to clients in a variety of industries and, in some cases, to households. Activities performed include: legal advice and representation; accounting, bookkeeping, and payroll services; architectural, engineering, and specialized design services; computer services; consulting services; research services; advertising services; photographic services; translation and interpretation services; veterinary services; and other professional, scientific, and technical services. This sector excludes establishments primarily engaged in providing a range of day-to-day office administrative services, such as financial planning, billing and recordkeeping, personnel supply, and physical distribution and logistics. These establishments are classified in Sector 56, Administrative and Support and Waste Management and Remediation Services.
Employment is national May 2024 OEWS. "Typical pay" is Singulariki's own figure — the employment-weighted average of each occupation's national median wage — a rough center of the industry, not an official BLS number.
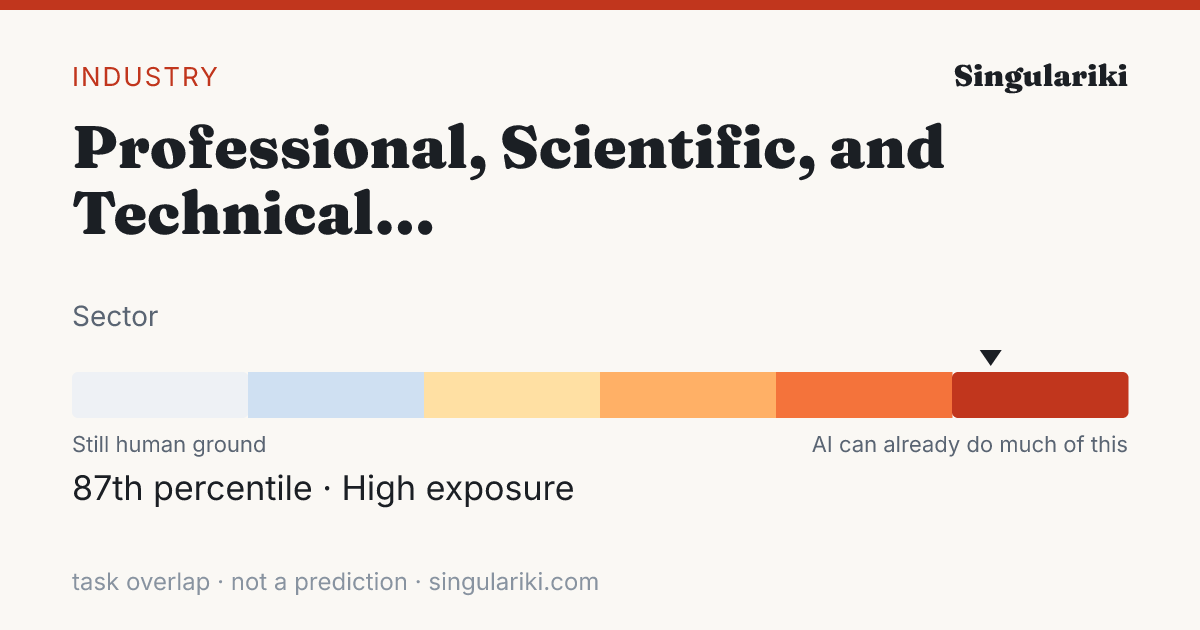
How exposed this industry is to AI
Weighting every occupation in this industry by its employment and its unified AI-exposure index (the OpenAI "GPTs are GPTs" human-rated task overlap folded with the Felten/Raj/Seamans AIOE index), this industry sits in the High band — 87th percentile across all industries.
Exposure measures how much of the work overlaps with what today's AI can do, not a prediction of automation; high-exposure industries are where AI is most likely to reshape tasks. Employment-weighted across 463 occupations that carry an exposure score. Compare every industry on the AI exposure hub.
How AI is actually used in this industry
Among measured Claude.ai (Free and Pro) conversations mapped to O*NET task statements (Anthropic Economic Index, 2026-01-15), these patterns are most associated with the occupations in this industry, weighted by its employment mix. They are shares of observed AI conversations — not of worker time, revenue, or what could be automated — and reflect one AI assistant's consumer sample, not all AI.
| Signal coverage | 72.0% of employment · 288/498 occupations have AEI task data |
| Augmentation vs. automation | 49.2% working with AI · 35.9% handed to AI |
| Most common pattern | Directive · AI does it; you give the instruction |
| Typical AI autonomy | 3.5 / 5 · higher = AI acts more independently |
Tasks driving the signal
The task families that account for the most AI activity across this industry's occupations (employment × observed usage), each attributed to the occupation it comes from.
| Task | Occupation | How | Share of signal |
|---|---|---|---|
| Troubleshoot problems involving office equipment, such as computer hardware and software. | Office Clerks, General | Feedback loop | 16.2% |
| Use computers for various applications, such as database management or word processing. | Secretaries and Administrative Assistants, Except Legal, Medical, and Executive | Directive | 3.5% |
| Conduct searches to find needed information, using such sources as the Internet. | Secretaries and Administrative Assistants, Except Legal, Medical, and Executive | Directive | 3.2% |
| Document findings of study and prepare recommendations for implementation of new systems, procedures, or organizational changes. | Management Analysts | Iteration | 2.6% |
| Develop or maintain internal or external company Web sites. | Secretaries and Administrative Assistants, Except Legal, Medical, and Executive | Directive | 2.4% |
| Interpret laws, rulings and regulations for individuals and businesses. | Lawyers | Learning | 1.8% |
| Prepare, rewrite and edit copy to improve readability, or supervise others who do this work. | Editors | Iteration | 1.7% |
| Participate in the work of subordinates to facilitate productivity or to overcome difficult aspects of work. | First-Line Supervisors of Office and Administrative Support Workers | Iteration | 1.6% |
| Edit, standardize, or make changes to material prepared by other writers or establishment personnel. | Technical Writers | Iteration | 1.4% |
| Analyze business operations, trends, costs, revenues, financial commitments, and obligations to project future revenues and expenses or to provide advice. | Accountants and Auditors | Iteration | 1.4% |
| Develop factors such as themes, plots, characterizations, psychological analyses, historical environments, action, and dialogue, to create material. | Writers and Authors | Directive | 1.2% |
| Collect and analyze data on customer demographics, preferences, needs, and buying habits to identify potential markets and factors affecting product demand. | Market Research Analysts and Marketing Specialists | Directive | 1.2% |
Occupations behind the signal
The occupations whose AI-touched tasks contribute most to this industry's signal, by employment here.
| Occupation | Workers | Share | How they use AI |
|---|---|---|---|
| Accountants and Auditors | 483,970 | 4.5% | Directive |
| Lawyers | 470,370 | 4.4% | Learning |
| General and Operations Managers | 439,080 | 4.1% | Iteration |
| Management Analysts | 368,770 | 3.4% | Iteration |
| Paralegals and Legal Assistants | 286,280 | 2.7% | Iteration |
| Market Research Analysts and Marketing Specialists | 237,340 | 2.2% | Directive |
| Bookkeeping, Accounting, and Auditing Clerks | 211,760 | 2.0% | Directive |
| Computer and Information Systems Managers | 205,040 | 1.9% | Learning |
| Civil Engineers | 202,800 | 1.9% | Iteration |
| Office Clerks, General | 197,040 | 1.8% | Feedback loop |
| Customer Service Representatives | 195,800 | 1.8% | Directive |
| Secretaries and Administrative Assistants, Except Legal, Medical, and Executive | 187,180 | 1.7% | Directive |
This rollup is only as complete as the occupation-task matches available for the industry; the coverage figure above is shown so sparse industries do not look falsely precise. AI exposure is not the same as replacement.
Skill & tool metabolism
What this industry's work actually runs on. Each figure is the share of the industry's workers in occupations that significantly rely on a skill, knowledge area, or ability (O*NET importance ≥ 3 of 5), or that use a tool category — its employment reach. This is a measure of how widespread a requirement is across the workforce, not how intensively any one worker uses it. Shares are independent and need not add to 100%.
Based on 92.4% of this industry's employment that maps to a detailed occupation with an O*NET skill profile.
Skills
| Skill | Employment reach | Workers |
|---|---|---|
| Active Listening | 91.7% | 9,876,190 |
| Reading Comprehension | 91.0% | 9,796,340 |
| Speaking | 90.8% | 9,774,910 |
| Critical Thinking | 90.5% | 9,741,100 |
| Writing | 88.5% | 9,526,660 |
| Monitoring | 87.3% | 9,400,380 |
| Time Management | 86.5% | 9,313,250 |
| Judgment and Decision Making | 78.9% | 8,495,140 |
| Complex Problem Solving | 77.7% | 8,366,190 |
| Coordination | 77.6% | 8,356,710 |
| Active Learning | 75.1% | 8,092,700 |
| Social Perceptiveness | 68.5% | 7,374,370 |
Knowledge areas
| Knowledge area | Employment reach | Workers |
|---|---|---|
| English Language | 91.5% | 9,851,920 |
| Customer and Personal Service | 83.6% | 9,001,250 |
| Computers and Electronics | 76.7% | 8,257,370 |
| Administration and Management | 62.3% | 6,712,420 |
| Mathematics | 61.5% | 6,628,550 |
| Administrative | 46.7% | 5,032,310 |
| Law and Government | 28.5% | 3,066,290 |
| Education and Training | 25.5% | 2,745,850 |
| Engineering and Technology | 23.8% | 2,563,490 |
| Economics and Accounting | 23.4% | 2,517,110 |
| Communications and Media | 21.0% | 2,266,320 |
| Personnel and Human Resources | 19.2% | 2,064,200 |
Abilities
| Abilitie | Employment reach | Workers |
|---|---|---|
| Near Vision | 92.3% | 9,942,460 |
| Oral Comprehension | 92.2% | 9,928,490 |
| Oral Expression | 92.1% | 9,919,090 |
| Speech Recognition | 91.3% | 9,836,700 |
| Speech Clarity | 91.2% | 9,821,560 |
| Information Ordering | 90.7% | 9,763,310 |
| Written Comprehension | 90.7% | 9,772,800 |
| Problem Sensitivity | 90.3% | 9,728,560 |
| Deductive Reasoning | 89.7% | 9,661,430 |
| Written Expression | 88.9% | 9,578,510 |
| Inductive Reasoning | 87.7% | 9,447,390 |
| Category Flexibility | 85.7% | 9,226,790 |
Tool categories
| Tool category | Employment reach | Workers |
|---|---|---|
| Spreadsheet software | 98.5% | 10,606,670 |
| Office suite software | 98.2% | 10,573,240 |
| Word processing software | 96.9% | 10,435,500 |
| Electronic mail software | 96.6% | 10,406,480 |
| Presentation software | 95.3% | 10,260,280 |
| Data base user interface and query software | 93.1% | 10,029,510 |
| Project management software | 84.7% | 9,124,380 |
| Document management software | 84.0% | 9,050,500 |
| Enterprise resource planning ERP software | 81.1% | 8,729,230 |
| Analytical or scientific software | 77.3% | 8,328,020 |
| Operating system software | 74.6% | 8,035,490 |
| Desktop publishing software | 69.2% | 7,447,760 |
| Customer relationship management CRM software | 66.2% | 7,131,940 |
| Internet browser software | 65.5% | 7,058,570 |
| Graphics or photo imaging software | 62.4% | 6,723,130 |
Reach = share of industry employment in occupations where the requirement is significant; it is not a per-worker usage or proficiency measure. Skill, knowledge, and ability importance is from O*NET; tool use is reported presence of a technology category.
Largest occupations
The occupations that employ the most people in this industry, with their share of the industry's workforce and national median pay for the occupation (not industry-specific pay).
Showing the top 40 of 573 occupations by employment.
Most distinctive occupations
The occupations most unusually concentrated in this industry compared with the economy as a whole. The location quotient is how many times more common an occupation is here versus its economy-wide share (a value of 5 means five times as concentrated).
For a sector this broad, the location quotient has a ceiling set by the sector's own share of national employment, so the top values tend to cluster near that limit.
| Occupation | Concentration | Workers |
|---|---|---|
| Tax Preparers | 13.93× | 71,590 |
| Veterinary Technologists and Technicians | 13.19× | 120,950 |
| Veterinarians | 12.97× | 73,060 |
| Veterinary Assistants and Laboratory Animal Caretakers | 12.95× | 103,290 |
| Architects, Except Landscape and Naval | 12.71× | 98,630 |
| Industrial-Organizational Psychologists | 11.86× | 870 |
| Legal Secretaries and Administrative Assistants | 11.66× | 125,840 |
| Paralegals and Legal Assistants | 11.16× | 286,280 |
| Surveyors | 10.86× | 40,270 |
| Architectural and Civil Drafters | 10.81× | 82,740 |
| Surveying and Mapping Technicians | 9.59× | 38,010 |
| Biochemists and Biophysicists | 9.29× | 22,410 |
| Anthropologists and Archeologists | 9.15× | 5,160 |
| Lawyers | 9.01× | 470,370 |
| Interior Designers | 8.87× | 43,100 |
| Survey Researchers | 8.72× | 4,700 |
| Environmental Engineering Technologists and Technicians | 8.7× | 7,600 |
| Landscape Architects | 8.62× | 11,790 |
| Paperhangers | 8.48× | 900 |
| Advertising and Promotions Managers | 8.37× | 12,330 |
Sub-industries
More detailed industries within Professional, Scientific, and Technical Services.
Write a report on thisheadline · factoids · citation
The Professional, Scientific, and Technical Services workforce sits at the 87th percentile of AI task overlap — 10,769,430 U.S. workers
- Weighting every occupation by its real share of Professional, Scientific, and Technical Services employment, the industry's workforce ranks in the 87th percentile (High band) for AI task overlap — overlap with what AI can attempt, not a measure of jobs at risk.Eloundou et al. + Felten AIOE, weighted by BLS OEWS
- The industry employs about 10,769,430 U.S. workers across 573 occupations.BLS OEWS (May 2024)
- Employment-weighted typical annual pay is about $94,982.BLS OEWS (May 2024)
- Of AI use observed across this industry's occupations, 49% looks like augmentation rather than automation — from a Claude.ai sample, not a census.Anthropic Economic Index
The Professional, Scientific, and Technical Services workforce sits at the 87th percentile of AI task overlap — 10,769,430 U.S. workers

• Weighting every occupation by its real share of Professional, Scientific, and Technical Services employment, the industry's workforce ranks in the 87th percentile (High band) for AI task overlap — overlap with what AI can attempt, not a measure of jobs at risk. (Eloundou et al. + Felten AIOE, weighted by BLS OEWS)
• The industry employs about 10,769,430 U.S. workers across 573 occupations. (BLS OEWS (May 2024))
• Employment-weighted typical annual pay is about $94,982. (BLS OEWS (May 2024))
• Of AI use observed across this industry's occupations, 49% looks like augmentation rather than automation — from a Claude.ai sample, not a census. (Anthropic Economic Index)

Source: Singulariki — "Professional, Scientific, and Technical Services". https://singulariki.com/industries/54
Note: AI task overlap measures what today's AI can attempt, not automation, job loss, or a forecast.
AssetsShare imageMethodology & sourcesPress & newsroomThe newsroom
Every line is built only from figures this page already shows and cites. AI task overlap means what today's AI can attempt — not automation, job loss, or a forecast.
Sources for this page
Every figure above traces to a named public dataset and the exact release below — not hand-written opinion. See the full methodology for what each measure does and does not mean.
- O*NET 30.3 U.S. Department of Labor / National Center for O*NET Development
- BLS Occupational Employment and Wage Statistics (OEWS) May 2024 U.S. Bureau of Labor Statistics
- Census NAICS 2022 U.S. Census Bureau
- Anthropic Economic Index v4 (2026-01-15) + v2 (2025-03-27) Anthropic
- “GPTs are GPTs” (Eloundou et al.) arXiv 2303.10130 OpenAI / academic
- AI Occupational Exposure (AIOE) Felten, Raj & Seamans academic
Data compiled June 3, 2026. Figures are estimates, not advice.
Cite this page
Singulariki. "Professional, Scientific, and Technical Services." Singulariki: a source-backed encyclopedia of work. Built from O*NET 30.3; BLS Occupational Employment and Wage Statistics (OEWS) May 2024; Census NAICS 2022; Anthropic Economic Index v4 (2026-01-15) + v2 (2025-03-27); “GPTs are GPTs” (Eloundou et al.) arXiv 2303.10130; AI Occupational Exposure (AIOE) Felten, Raj & Seamans. Accessed June 7, 2026. https://singulariki.com/industries/54
Singulariki. (2026). Professional, Scientific, and Technical Services. Singulariki: a source-backed encyclopedia of work. Retrieved June 7, 2026, from https://singulariki.com/industries/54
@misc{singulariki-54,
  title  = {Professional, Scientific, and Technical Services},
  author = {{Singulariki}},
  year   = {2026},
  note   = {O*NET 30.3; BLS Occupational Employment and Wage Statistics (OEWS) May 2024; Census NAICS 2022; Anthropic Economic Index v4 (2026-01-15) + v2 (2025-03-27); “GPTs are GPTs” (Eloundou et al.) arXiv 2303.10130; AI Occupational Exposure (AIOE) Felten, Raj & Seamans. Accessed June 7, 2026},
  url    = {https://singulariki.com/industries/54}
} Citations name the underlying public dataset releases — they reflect what this page is built from, not just the URL.