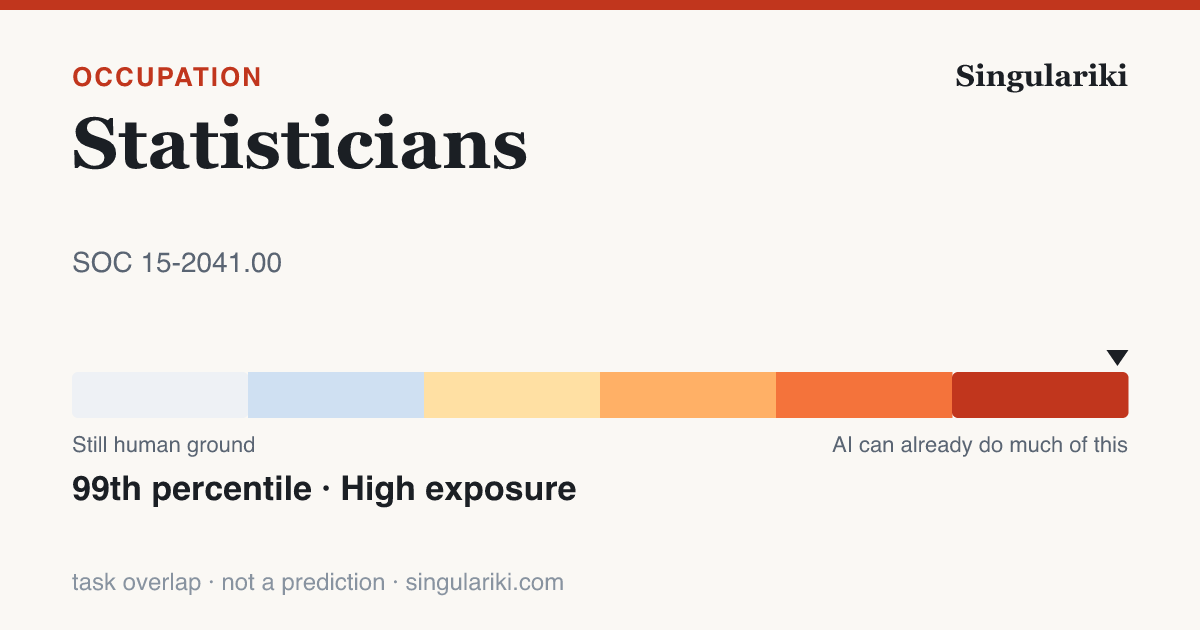
Develop or apply mathematical or statistical theory and methods to collect, organize, interpret, and summarize numerical data to provide usable information. May specialize in fields such as biostatistics, agricultural statistics, business statistics, or economic statistics. Includes mathematical and survey statisticians.
A source-stamped Markdown brief of this occupation — paste it into an agent, or fetch
/roles/role-15-2041-00/context.md directly.
AI work map
A fast read on where AI already shows up in this occupation, where it stays a copilot,
where humans remain in the loop, and what the labor market is doing. Built from observed
Claude.ai conversations mapped to O*NET tasks and from published research — measures of
usage and exposure, not advice or predictions that the job is going away.
Often handed to AI
Task areas most often handled directively in observed AI conversations —
candidates to delegate with light review.
Prepare data for processing by organizing information, checking for any inaccuracies, and adjusting and weighting the raw data. · 4.2%
Report results of statistical analyses, including information in the form of graphs, charts, and tables. · 3.5%
Develop software applications or programming to use for statistical modeling and graphic analysis. · 1.6%
Task areas where a human was still judged necessary in a large share of observed
conversations — not a safety ruling, an observed-need signal.
Evaluate sources of information to determine any limitations in terms of reliability or usability. · 97.4% need a human
Prepare data for processing by organizing information, checking for any inaccuracies, and adjusting and weighting the raw data. · 92.3% need a human
Examine theories, such as those of probability and inference, to discover mathematical bases for new or improved methods of obtaining and evaluating numerical data. · 87.9% need a human
↔99th-percentile task overlap — yet
about 2,000 openings a year
(+8.5% projected, BLS), and
observed AI use leans 5420% copilot, not hand-off (AEI)
. What exposure means →
AI & job outlook
What today's research says about this occupation's exposure to AI, how AI is
actually being used in it, and where employment is headed. These are positions
within published studies — measures of exposure and usage, not predictions
that this job will disappear.
Exposure to current AI
Each study uses its own scale, so the raw scores are not comparable across rows —
the percentile (this job's rank among all U.S. occupations with
data) is the comparable figure, and sizes the bars.
Measure
Rank vs all occupations
Percentile
Score
Overall AI exposure (Felten et al.) High
95th
1.4
LLM task exposure, γ (OpenAI / Eloundou) High
95th
1.0
AI assistant applicability (Microsoft) High
92nd
0.3
OpenAI's exposure study scores tasks three ways: with a language model alone
(α 0.6), with simple added tooling
(β 0.8), and including AI-powered software
(γ 1.0). Higher means more of the job's
tasks could be done at least twice as fast — not that they will be automated away.
Most of this job's tasks can be done remotely (Dingel–Neiman), which tends to track with higher digital and AI exposure.
Historical automation estimate (2013)
A pre-LLM (2013) estimate of how automatable this job is by computerization and robotics. Shown for historical context only — it is not part of any current AI ranking.
Frey–Osborne probability 0.2 ·
34th percentile among occupations ·
Moderate
How AI is actually used in this job
Among measured AI assistant conversations mapped to this occupation (Anthropic
Economic Index, 2026-01-15), these
task types came up most. These are shares of observed AI conversations —
not shares of the job, of worker time, or of what could be automated.
Examine theories, such as those of probability and inference, to discover mathematical bases for new or improved methods of obtaining and evaluating numerical data.
10.0%
Report results of statistical analyses, including information in the form of graphs, charts, and tables.
7.6%
Process large amounts of data for statistical modeling and graphic analysis, using computers.
5.7%
Identify relationships and trends in data, as well as any factors that could affect the results of research.
5.3%
Report results of statistical analyses in peer-reviewed papers and technical manuals.
2.2%
Develop and test experimental designs, sampling techniques, and analytical methods.
0.5%
Job outlook
Independent U.S. Bureau of Labor Statistics employment projection for 2024–2034 —
a labor-market forecast, not an AI-impact forecast.
Outlook
Growing fast · +8.5% by 2034
Projected annual openings
2,000
Employment 2024 → 2034
32,200 → 34,900
“Annual openings” counts new jobs plus replacements for workers who leave the
occupation, so it can be large even when growth is modest.
Where this work sits on the global GenAI gradient
The ILO's 2025 global study scores generative-AI exposure on the international ISCO-08
occupation system, not US SOC. Bridged through the published (and approximate,
many-to-many) IBS O*NET-SOC ↔ ISCO-08 crosswalk, this US occupation corresponds to the
international occupation below. Exposure here means how much of the work's tasks today's AI can attempt — task
overlap, not automation, adoption, or jobs lost.
Statisticians sits at the 94th percentile of 427
occupations on the global GenAI task-exposure gradient
— exposure rose from 2023 to 2025. Each dot is one occupation; the
ringed one is this work. Exposure is task overlap, not automation or jobs lost.
Read the whole six-band gradient on the GenAI exposure gradient page.
The crosswalk is approximate: a US occupation can map to several international ones, and the
ILO scores describe the international occupation, not this exact US role.
Working with AI in this job
How people actually apply AI to this occupation's tasks, from Claude.ai (Free and Pro) conversations in the Anthropic Economic
Index, 2026-01-15. This is one AI
assistant's consumer sample — not all AI, not the whole workforce. Autonomy and the
collaboration mix are model-rated estimates; figures below the sample floor are hidden.
Augmentation vs. automation
54.2% working with AI · 39.5% handed to AI
Most common way people use AI here
Directive · AI does it; you give the instruction
Typical AI autonomy
4.0 / 5
· higher = AI acts more independently
Used for work (vs. personal / coursework)
34.0%
What people delegate to AI
The role's most common tasks in AI conversations, each tagged with how people work
with the AI on it. “Usage” is the share of observed conversations, not of
the job.
Task
How
Usage
Evaluate sources of information to determine any limitations in terms of reliability or usability.
Validation
5.5%
Prepare data for processing by organizing information, checking for any inaccuracies, and adjusting and weighting the raw data.
Directive
4.2%
Report results of statistical analyses, including information in the form of graphs, charts, and tables.
Directive
3.5%
Develop and test experimental designs, sampling techniques, and analytical methods.
Learning
2.1%
Develop an understanding of fields to which statistical methods are to be applied to determine whether methods and results are appropriate.
Learning
1.9%
Develop software applications or programming to use for statistical modeling and graphic analysis.
Directive
1.6%
Design research projects that apply valid scientific techniques and use information obtained from baselines or historical data to structure uncompromised and efficient analyses.
Directive
1.5%
Report results of statistical analyses in peer-reviewed papers and technical manuals.
Directive
1.4%
Where a human is still needed
Tasks where the model most often judged that a person remained necessary — a useful
read on the current boundary, not a guarantee.
Evaluate sources of information to determine any limitations in terms of reliability or usability.
97.4%
Prepare data for processing by organizing information, checking for any inaccuracies, and adjusting and weighting the raw data.
92.3%
Examine theories, such as those of probability and inference, to discover mathematical bases for new or improved methods of obtaining and evaluating numerical data.
87.9%
Develop an understanding of fields to which statistical methods are to be applied to determine whether methods and results are appropriate.
87.8%
Design research projects that apply valid scientific techniques and use information obtained from baselines or historical data to structure uncompromised and efficient analyses.
84.9%
Report results of statistical analyses, including information in the form of graphs, charts, and tables.
83.3%
What people most often hand AI here
Example prompts phrased from the tasks people most often delegate to AI in this
occupation (Anthropic Economic Index). Each shows the underlying measured task and its
share of observed AI use. They are suggested phrasings of real tasks — starting points,
not endorsed instructions.
Help me evaluate sources of information to determine any limitations in terms of reliability or usability.
From: Evaluate sources of information to determine any limitations in terms of reliability or usability. · 5.5% of measured AI use · validation
Help me prepare data for processing by organizing information, checking for any inaccuracies, and adjusting and weighting the raw data.
From: Prepare data for processing by organizing information, checking for any inaccuracies, and adjusting and weighting the raw data. · 4.2% of measured AI use · directive
Help me report results of statistical analyses, including information in the form of graphs, charts, and tables.
From: Report results of statistical analyses, including information in the form of graphs, charts, and tables. · 3.5% of measured AI use · directive
Help me develop and test experimental designs, sampling techniques, and analytical methods.
From: Develop and test experimental designs, sampling techniques, and analytical methods. · 2.1% of measured AI use · learning
Tasks
All 19 tasks O*NET lists for this occupation, ordered by importance.
Each links to its own page with AI-exposure and observed-use detail.
How characteristic each condition is of the job, on O*NET's 1–5 context scale
(higher = more present in day-to-day work). Each condition links to how it varies
across all occupations.
Most of these occupations require graduate school. For example, they may require a master's degree, and some require a Ph.D., M.D., or J.D. (law degree).
Extensive skill, knowledge, and experience are needed for these occupations. Many require more than five years of experience. For example, surgeons must complete four years of college and an additional five to seven years of specialized medical training to be able to do their job.
Preparation level
SVP (8.0 and above) — total schooling plus on-the-job experience.
Annual wages by percentile — U.S. (BLS OEWS). The light
band spans the 10th–90th percentile; the darker band is the middle half (25th–75th); the line
is the median.
Projected U.S. employment, 2024–2034 (BLS Employment Projections). A labor-market forecast for
the occupation, not an AI-impact forecast.
10th percentile
$60,390
25th percentile
$79,210
Median (50th)
$103,300
75th percentile
$137,610
90th percentile
$170,700
People employed
29,800
Industries that employ this occupation
Where these workers are employed, by number of jobs (national, BLS OEWS). Pay shown is
the occupation's national median, not industry-specific.
Industries where this occupation is far more common than in the economy as a whole.
The location quotient is how many times more concentrated it is here (a value of 5
means five times its economy-wide share).
AI task-overlap percentile (horizontal) vs. median-pay percentile (vertical), across all scored occupations. This occupation is highlighted; related occupations are plotted alongside it. Overlap measures shared tasks with AI, not automation.
▸Write a report on thisheadline · factoids · citation
Statisticians show 99th-percentile AI task overlap — and about 2,000 annual U.S. openings
Statisticians rank in the 99th percentile (High band) for AI task overlap across U.S. occupations — a measure of how much of the work today's AI can attempt, not how much is automated.Eloundou et al. (GPTs are GPTs) + Felten AIOE
The occupation is projected to see about 2,000 U.S. job openings per year (2024–34), counting growth and replacement — a labor-demand projection made independently of AI.BLS Employment Projections 2024–34
BLS projects employment to be growing fast (+8.5%) from 2024 to 2034.BLS Employment Projections 2024–34
Median annual pay is $103,300, across about 29,800 U.S. workers.BLS OEWS (May 2024)
Of the AI use actually observed for this work, 54% looks like augmentation (drafting, iterating, checking) rather than hands-off automation — from a Claude.ai usage sample, not a census.2026-01-15-v4-plus-2025-03-27-v2
Copy the whole kit
Statisticians show 99th-percentile AI task overlap — and about 2,000 annual U.S. openings

• Statisticians rank in the 99th percentile (High band) for AI task overlap across U.S. occupations — a measure of how much of the work today's AI can attempt, not how much is automated. (Eloundou et al. (GPTs are GPTs) + Felten AIOE)
• The occupation is projected to see about 2,000 U.S. job openings per year (2024–34), counting growth and replacement — a labor-demand projection made independently of AI. (BLS Employment Projections 2024–34)
• BLS projects employment to be growing fast (+8.5%) from 2024 to 2034. (BLS Employment Projections 2024–34)
• Median annual pay is $103,300, across about 29,800 U.S. workers. (BLS OEWS (May 2024))
• Of the AI use actually observed for this work, 54% looks like augmentation (drafting, iterating, checking) rather than hands-off automation — from a Claude.ai usage sample, not a census. (2026-01-15-v4-plus-2025-03-27-v2)

Source: Singulariki — "Statisticians". https://singulariki.com/roles/role-15-2041-00
Note: AI task overlap measures what today's AI can attempt, not automation, job loss, or a forecast.
Every line is built only from figures this page already shows and cites. AI task overlap means
what today's AI can attempt — not automation, job loss, or a forecast.
Sources for this page
Every figure above traces to a named public dataset and the exact release below — not
hand-written opinion. See the full methodology for what each
measure does and does not mean.
O*NET 30.3U.S. Department of Labor / National Center for O*NET Development
Data compiled June 2, 2026. Figures are estimates, not advice.
Cite this page
Plain
Singulariki. "Statisticians." Singulariki: a source-backed encyclopedia of work. Built from O*NET 30.3; BLS Occupational Employment and Wage Statistics (OEWS) May 2024; BLS Employment Projections 2024–2034; Anthropic Economic Index v4 (2026-01-15) + v2 (2025-03-27); Microsoft “Working with AI” working-with-ai; “GPTs are GPTs” (Eloundou et al.) arXiv 2303.10130; AI Occupational Exposure (AIOE) Felten, Raj & Seamans; ILO / Gmyrek et al. GenAI exposure gradient 2025; IBS O*NET-SOC ↔ ISCO-08 occupation crosswalk 2022; Frey & Osborne (2013) frey-osborne-automation; Dingel & Neiman (2020) dingel-neiman-workathome. Accessed June 7, 2026. https://singulariki.com/roles/role-15-2041-00
APA
Singulariki. (2026). Statisticians. Singulariki: a source-backed encyclopedia of work. Retrieved June 7, 2026, from https://singulariki.com/roles/role-15-2041-00
BibTeX
@misc{singulariki-role-15-2041-00,
  title  = {Statisticians},
  author = {{Singulariki}},
  year   = {2026},
  note   = {O*NET 30.3; BLS Occupational Employment and Wage Statistics (OEWS) May 2024; BLS Employment Projections 2024–2034; Anthropic Economic Index v4 (2026-01-15) + v2 (2025-03-27); Microsoft “Working with AI” working-with-ai; “GPTs are GPTs” (Eloundou et al.) arXiv 2303.10130; AI Occupational Exposure (AIOE) Felten, Raj & Seamans; ILO / Gmyrek et al. GenAI exposure gradient 2025; IBS O*NET-SOC ↔ ISCO-08 occupation crosswalk 2022; Frey & Osborne (2013) frey-osborne-automation; Dingel & Neiman (2020) dingel-neiman-workathome. Accessed June 7, 2026},
  url    = {https://singulariki.com/roles/role-15-2041-00}
}
Citations name the underlying public dataset releases — they reflect what this page is built from, not just the URL.
Embed this chart
Paste this into any page. It links back here for attribution.