Offices of Chiropractors
National industry · NAICS 621310
A source-stamped Markdown brief of this occupation — paste it into an agent, or fetch
/industries/621310/context.md directly.
Offices of Chiropractors is a U.S. industry in the NAICS classification. The Bureau of Labor Statistics estimates about 145,870 workers across 60 detailed occupations in it. A typical worker earns around $52,242 a year (Singulariki estimate, see below).
This industry comprises establishments of health practitioners having the degree of D.C. (Doctor of Chiropractic) primarily engaged in the independent practice of chiropractic. These practitioners provide diagnostic and therapeutic treatment of neuromusculoskeletal and related disorders through the manipulation and adjustment of the spinal column and extremities, and operate private or group practices in their own offices (e.g., centers, clinics) or in the facilities of others, such as hospitals or HMO medical centers.
Employment is national May 2024 OEWS. "Typical pay" is Singulariki's own figure — the employment-weighted average of each occupation's national median wage — a rough center of the industry, not an official BLS number.
How exposed this industry is to AI
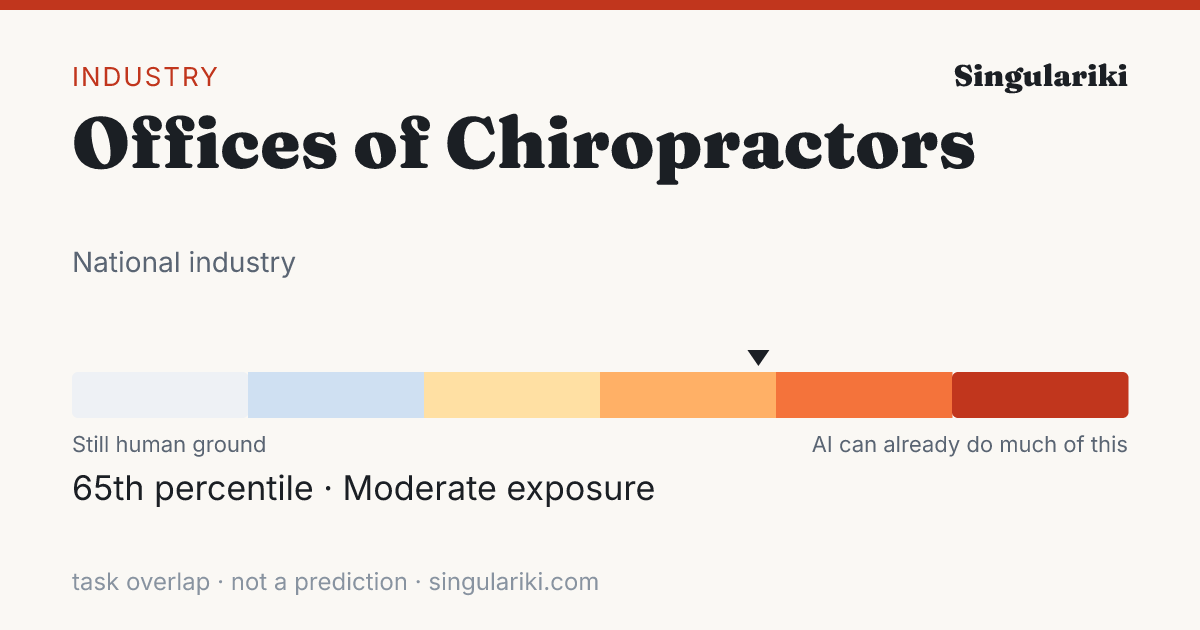
Weighting every occupation in this industry by its employment and its unified AI-exposure index (the OpenAI "GPTs are GPTs" human-rated task overlap folded with the Felten/Raj/Seamans AIOE index), this industry sits in the Moderate band — 65th percentile across all industries.
Exposure measures how much of the work overlaps with what today's AI can do, not a prediction of automation; high-exposure industries are where AI is most likely to reshape tasks. Employment-weighted across 47 occupations that carry an exposure score. Compare every industry on the AI exposure hub.
How AI is actually used in this industry
Among measured Claude.ai (Free and Pro) conversations mapped to O*NET task statements (Anthropic Economic Index, 2026-01-15), these patterns are most associated with the occupations in this industry, weighted by its employment mix. They are shares of observed AI conversations — not of worker time, revenue, or what could be automated — and reflect one AI assistant's consumer sample, not all AI.
| Signal coverage | 97.8% of employment · 34/47 occupations have AEI task data |
| Augmentation vs. automation | 48.3% working with AI · 27.1% handed to AI |
| Most common pattern | Learning · you ask AI to explain or teach |
| Typical AI autonomy | 3.4 / 5 · higher = AI acts more independently |
Tasks driving the signal
The task families that account for the most AI activity across this industry's occupations (employment × observed usage), each attributed to the occupation it comes from.
| Task | Occupation | How | Share of signal |
|---|---|---|---|
| Troubleshoot problems involving office equipment, such as computer hardware and software. | Office Clerks, General | Feedback loop | 55.2% |
| Participate in the work of subordinates to facilitate productivity or to overcome difficult aspects of work. | First-Line Supervisors of Office and Administrative Support Workers | Iteration | 5.1% |
| Use computers for various applications, such as database management or word processing. | Secretaries and Administrative Assistants, Except Legal, Medical, and Executive | Directive | 4.1% |
| Conduct searches to find needed information, using such sources as the Internet. | Secretaries and Administrative Assistants, Except Legal, Medical, and Executive | Directive | 3.8% |
| Process and prepare memos, correspondence, travel vouchers, or other documents. | Receptionists and Information Clerks | Iteration | 3.1% |
| Develop or maintain internal or external company Web sites. | Secretaries and Administrative Assistants, Except Legal, Medical, and Executive | Directive | 2.8% |
| Explain treatment procedures, medications, diets, or physicians' instructions to patients. | Medical Assistants | Learning | 2.7% |
| Process and prepare documents, such as business or government forms and expense reports. | Office Clerks, General | Directive | 2.2% |
| Complete work schedules, manage calendars, and arrange appointments. | Office Clerks, General | Directive | 1.3% |
| Prepare correspondence or assist physicians or medical scientists with preparation of reports, speeches, articles, or conference proceedings. | Medical Secretaries and Administrative Assistants | Iteration | 1.2% |
| Provide employees with guidance in handling difficult or complex problems or in resolving escalated complaints or disputes. | First-Line Supervisors of Office and Administrative Support Workers | Iteration | 1.0% |
| Schedule appointments and maintain and update appointment calendars. | Receptionists and Information Clerks | Directive | 1.0% |
Occupations behind the signal
The occupations whose AI-touched tasks contribute most to this industry's signal, by employment here.
| Occupation | Workers | Share | How they use AI |
|---|---|---|---|
| Chiropractors | 35,150 | 24.1% | Learning |
| Medical Assistants | 26,830 | 18.4% | Learning |
| Receptionists and Information Clerks | 18,300 | 12.6% | Directive |
| Medical Secretaries and Administrative Assistants | 16,310 | 11.2% | Iteration |
| Office Clerks, General | 11,000 | 7.5% | Feedback loop |
| Massage Therapists | 10,990 | 7.5% | Learning |
| First-Line Supervisors of Office and Administrative Support Workers | 6,310 | 4.3% | Iteration |
| Billing and Posting Clerks | 4,310 | 2.9% | Directive |
| Secretaries and Administrative Assistants, Except Legal, Medical, and Executive | 3,610 | 2.5% | Directive |
| Bookkeeping, Accounting, and Auditing Clerks | 1,690 | 1.2% | Directive |
| Physical Therapists | 1,030 | 0.7% | Learning |
| General and Operations Managers | 950 | 0.7% | Iteration |
This rollup is only as complete as the occupation-task matches available for the industry; the coverage figure above is shown so sparse industries do not look falsely precise. AI exposure is not the same as replacement.
Skill & tool metabolism
What this industry's work actually runs on. Each figure is the share of the industry's workers in occupations that significantly rely on a skill, knowledge area, or ability (O*NET importance ≥ 3 of 5), or that use a tool category — its employment reach. This is a measure of how widespread a requirement is across the workforce, not how intensively any one worker uses it. Shares are independent and need not add to 100%.
Based on 99.8% of this industry's employment that maps to a detailed occupation with an O*NET skill profile.
Skills
| Skill | Employment reach | Workers |
|---|---|---|
| Active Listening | 99.8% | 145,560 |
| Speaking | 99.7% | 145,450 |
| Reading Comprehension | 99.5% | 145,070 |
| Critical Thinking | 99.4% | 145,010 |
| Writing | 99.0% | 144,480 |
| Social Perceptiveness | 95.2% | 138,830 |
| Service Orientation | 94.5% | 137,900 |
| Coordination | 87.1% | 126,980 |
| Monitoring | 79.4% | 115,820 |
| Time Management | 79.0% | 115,230 |
| Complex Problem Solving | 71.8% | 104,700 |
| Judgment and Decision Making | 63.4% | 92,520 |
Knowledge areas
| Knowledge area | Employment reach | Workers |
|---|---|---|
| English Language | 99.5% | 145,070 |
| Customer and Personal Service | 99.4% | 144,940 |
| Administrative | 89.3% | 130,320 |
| Computers and Electronics | 81.9% | 119,540 |
| Medicine and Dentistry | 65.0% | 94,880 |
| Administration and Management | 57.7% | 84,160 |
| Education and Training | 47.2% | 68,780 |
| Therapy and Counseling | 45.5% | 66,380 |
| Personnel and Human Resources | 40.8% | 59,580 |
| Psychology | 36.4% | 53,120 |
| Biology | 34.5% | 50,290 |
| Sales and Marketing | 32.6% | 47,620 |
Abilities
| Abilitie | Employment reach | Workers |
|---|---|---|
| Near Vision | 99.8% | 145,560 |
| Oral Comprehension | 99.8% | 145,560 |
| Oral Expression | 99.8% | 145,560 |
| Speech Clarity | 99.5% | 145,070 |
| Speech Recognition | 99.5% | 145,120 |
| Written Comprehension | 99.5% | 145,070 |
| Written Expression | 99.3% | 144,870 |
| Problem Sensitivity | 87.2% | 127,150 |
| Inductive Reasoning | 86.8% | 126,600 |
| Deductive Reasoning | 86.7% | 126,540 |
| Information Ordering | 79.3% | 115,610 |
| Category Flexibility | 79.2% | 115,560 |
Tool categories
| Tool category | Employment reach | Workers |
|---|---|---|
| Spreadsheet software | 100.0% | 145,870 |
| Word processing software | 99.9% | 145,760 |
| Medical software | 98.6% | 143,880 |
| Electronic mail software | 92.5% | 134,880 |
| Office suite software | 92.5% | 134,880 |
| Calendar and scheduling software | 91.4% | 133,300 |
| Billing and invoicing software | 80.0% | 116,680 |
| Data base user interface and query software | 66.8% | 97,400 |
| Presentation software | 66.8% | 97,480 |
| Internet browser software | 66.0% | 96,240 |
| Operating system software | 65.5% | 95,480 |
| Accounting software | 64.8% | 94,540 |
| Document management software | 53.7% | 78,290 |
| Enterprise resource planning ERP software | 46.2% | 67,450 |
| Cloud-based data access and sharing software | 42.2% | 61,550 |
Reach = share of industry employment in occupations where the requirement is significant; it is not a per-worker usage or proficiency measure. Skill, knowledge, and ability importance is from O*NET; tool use is reported presence of a technology category.
Largest occupations
The occupations that employ the most people in this industry, with their share of the industry's workforce and national median pay for the occupation (not industry-specific pay).
Showing the top 40 of 60 occupations by employment.
Most distinctive occupations
The occupations most unusually concentrated in this industry compared with the economy as a whole. The location quotient is how many times more common an occupation is here versus its economy-wide share (a value of 5 means five times as concentrated).
| Occupation | Concentration | Workers |
|---|---|---|
| Chiropractors | 987.35× | 35,150 |
| Massage Therapists | 120.96× | 10,990 |
| Medical Assistants | 35.74× | 26,830 |
| Acupuncturists | 31.31× | 250 |
| Medical Secretaries and Administrative Assistants | 20.75× | 16,310 |
| Receptionists and Information Clerks | 20.05× | 18,300 |
| Billing and Posting Clerks | 10.91× | 4,310 |
| Physical Therapist Assistants | 7.83× | 800 |
| Therapists, All Other | 6.57× | 120 |
| Office Clerks, General | 4.63× | 11,000 |
| First-Line Supervisors of Office and Administrative Support Workers | 4.46× | 6,310 |
| Physical Therapists | 4.38× | 1,030 |
| Healthcare Support Workers, All Other | 3.47× | 340 |
| File Clerks | 3.21× | 240 |
| Nurse Practitioners | 2.75× | 800 |
| Physician Assistants | 2.72× | 400 |
| Insurance Claims and Policy Processing Clerks | 2.4× | 520 |
| Secretaries and Administrative Assistants, Except Legal, Medical, and Executive | 2.2× | 3,610 |
| Health Technologists and Technicians, All Other | 2.06× | 340 |
| Medical Records Specialists | 1.74× | 310 |
Write a report on thisheadline · factoids · citation
The Offices of Chiropractors workforce sits at the 65th percentile of AI task overlap — 145,870 U.S. workers
- Weighting every occupation by its real share of Offices of Chiropractors employment, the industry's workforce ranks in the 65th percentile (Moderate band) for AI task overlap — overlap with what AI can attempt, not a measure of jobs at risk.Eloundou et al. + Felten AIOE, weighted by BLS OEWS
- The industry employs about 145,870 U.S. workers across 60 occupations.BLS OEWS (May 2024)
- Employment-weighted typical annual pay is about $52,242.BLS OEWS (May 2024)
- Of AI use observed across this industry's occupations, 48% looks like augmentation rather than automation — from a Claude.ai sample, not a census.Anthropic Economic Index
The Offices of Chiropractors workforce sits at the 65th percentile of AI task overlap — 145,870 U.S. workers

• Weighting every occupation by its real share of Offices of Chiropractors employment, the industry's workforce ranks in the 65th percentile (Moderate band) for AI task overlap — overlap with what AI can attempt, not a measure of jobs at risk. (Eloundou et al. + Felten AIOE, weighted by BLS OEWS)
• The industry employs about 145,870 U.S. workers across 60 occupations. (BLS OEWS (May 2024))
• Employment-weighted typical annual pay is about $52,242. (BLS OEWS (May 2024))
• Of AI use observed across this industry's occupations, 48% looks like augmentation rather than automation — from a Claude.ai sample, not a census. (Anthropic Economic Index)

Source: Singulariki — "Offices of Chiropractors". https://singulariki.com/industries/621310
Note: AI task overlap measures what today's AI can attempt, not automation, job loss, or a forecast.
AssetsShare imageMethodology & sourcesPress & newsroomThe newsroom
Every line is built only from figures this page already shows and cites. AI task overlap means what today's AI can attempt — not automation, job loss, or a forecast.
Sources for this page
Every figure above traces to a named public dataset and the exact release below — not hand-written opinion. See the full methodology for what each measure does and does not mean.
- O*NET 30.3 U.S. Department of Labor / National Center for O*NET Development
- BLS Occupational Employment and Wage Statistics (OEWS) May 2024 U.S. Bureau of Labor Statistics
- Census NAICS 2022 U.S. Census Bureau
- Anthropic Economic Index v4 (2026-01-15) + v2 (2025-03-27) Anthropic
- “GPTs are GPTs” (Eloundou et al.) arXiv 2303.10130 OpenAI / academic
- AI Occupational Exposure (AIOE) Felten, Raj & Seamans academic
Data compiled June 3, 2026. Figures are estimates, not advice.
Cite this page
Singulariki. "Offices of Chiropractors." Singulariki: a source-backed encyclopedia of work. Built from O*NET 30.3; BLS Occupational Employment and Wage Statistics (OEWS) May 2024; Census NAICS 2022; Anthropic Economic Index v4 (2026-01-15) + v2 (2025-03-27); “GPTs are GPTs” (Eloundou et al.) arXiv 2303.10130; AI Occupational Exposure (AIOE) Felten, Raj & Seamans. Accessed June 7, 2026. https://singulariki.com/industries/621310
Singulariki. (2026). Offices of Chiropractors. Singulariki: a source-backed encyclopedia of work. Retrieved June 7, 2026, from https://singulariki.com/industries/621310
@misc{singulariki-621310,
  title  = {Offices of Chiropractors},
  author = {{Singulariki}},
  year   = {2026},
  note   = {O*NET 30.3; BLS Occupational Employment and Wage Statistics (OEWS) May 2024; Census NAICS 2022; Anthropic Economic Index v4 (2026-01-15) + v2 (2025-03-27); “GPTs are GPTs” (Eloundou et al.) arXiv 2303.10130; AI Occupational Exposure (AIOE) Felten, Raj & Seamans. Accessed June 7, 2026},
  url    = {https://singulariki.com/industries/621310}
} Citations name the underlying public dataset releases — they reflect what this page is built from, not just the URL.