Residential Intellectual and Developmental Disability Facilities
National industry · NAICS 623210
A source-stamped Markdown brief of this occupation — paste it into an agent, or fetch
/industries/623210/context.md directly.
Residential Intellectual and Developmental Disability Facilities is a U.S. industry in the NAICS classification. The Bureau of Labor Statistics estimates about 389,290 workers across 135 detailed occupations in it. A typical worker earns around $41,596 a year (Singulariki estimate, see below).
This industry comprises establishments (e.g., group homes, hospitals, intermediate care facilities) primarily engaged in providing residential care services for persons with intellectual and developmental disabilities. These facilities may provide some health care, though the focus is room, board, protective supervision, and counseling. Cross-References.
Employment is national May 2024 OEWS. "Typical pay" is Singulariki's own figure — the employment-weighted average of each occupation's national median wage — a rough center of the industry, not an official BLS number.
How exposed this industry is to AI
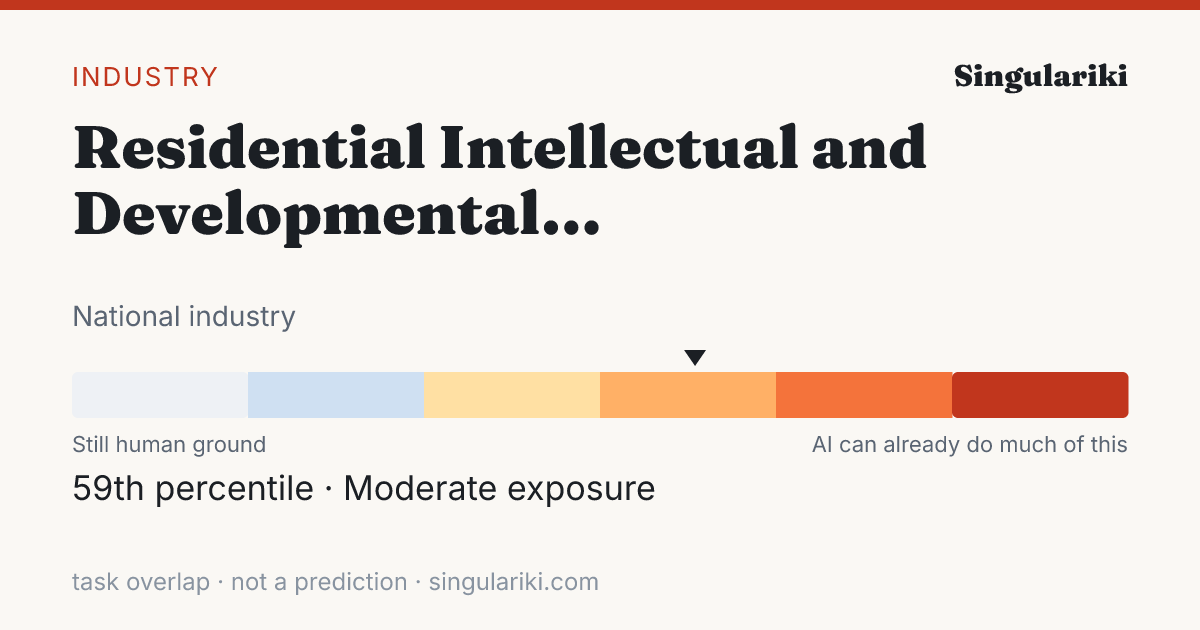
Weighting every occupation in this industry by its employment and its unified AI-exposure index (the OpenAI "GPTs are GPTs" human-rated task overlap folded with the Felten/Raj/Seamans AIOE index), this industry sits in the Moderate band — 59th percentile across all industries.
Exposure measures how much of the work overlaps with what today's AI can do, not a prediction of automation; high-exposure industries are where AI is most likely to reshape tasks. Employment-weighted across 115 occupations that carry an exposure score. Compare every industry on the AI exposure hub.
How AI is actually used in this industry
Among measured Claude.ai (Free and Pro) conversations mapped to O*NET task statements (Anthropic Economic Index, 2026-01-15), these patterns are most associated with the occupations in this industry, weighted by its employment mix. They are shares of observed AI conversations — not of worker time, revenue, or what could be automated — and reflect one AI assistant's consumer sample, not all AI.
| Signal coverage | 24.6% of employment · 83/127 occupations have AEI task data |
| Augmentation vs. automation | 47.2% working with AI · 33.5% handed to AI |
| Most common pattern | Directive · AI does it; you give the instruction |
| Typical AI autonomy | 3.5 / 5 · higher = AI acts more independently |
Tasks driving the signal
The task families that account for the most AI activity across this industry's occupations (employment × observed usage), each attributed to the occupation it comes from.
| Task | Occupation | How | Share of signal |
|---|---|---|---|
| Troubleshoot problems involving office equipment, such as computer hardware and software. | Office Clerks, General | Feedback loop | 28.6% |
| Use computers for various applications, such as database management or word processing. | Secretaries and Administrative Assistants, Except Legal, Medical, and Executive | Directive | 5.7% |
| Conduct searches to find needed information, using such sources as the Internet. | Secretaries and Administrative Assistants, Except Legal, Medical, and Executive | Directive | 5.3% |
| Direct or provide home health services. | Registered Nurses | Learning | 5.1% |
| Develop or maintain internal or external company Web sites. | Secretaries and Administrative Assistants, Except Legal, Medical, and Executive | Directive | 4.0% |
| Educate patients and family members about mental health and medical conditions, preventive health measures, medications, or treatment plans. | Registered Nurses | Learning | 3.5% |
| Instruct individuals in career development techniques such as job search and application strategies, resume writing, and interview skills. | Educational, Guidance, and Career Counselors and Advisors | Iteration | 2.4% |
| Teach patient education programs that include information required to make informed health care and treatment decisions. | Registered Nurses | Directive | 1.4% |
| Participate in the work of subordinates to facilitate productivity or to overcome difficult aspects of work. | First-Line Supervisors of Office and Administrative Support Workers | Iteration | 1.3% |
| Process and prepare documents, such as business or government forms and expense reports. | Office Clerks, General | Directive | 1.1% |
| Prepare responses to correspondence containing routine inquiries. | Executive Secretaries and Executive Administrative Assistants | Directive | 1.0% |
| Locate barriers to client employment, such as inaccessible work sites, inflexible schedules, and transportation problems, and work with clients to develop strategies for overcoming these barriers. | Rehabilitation Counselors | Iteration | 1.0% |
Occupations behind the signal
The occupations whose AI-touched tasks contribute most to this industry's signal, by employment here.
| Occupation | Workers | Share | How they use AI |
|---|---|---|---|
| Residential Advisors | 9,750 | 2.5% | Directive |
| Social and Human Service Assistants | 8,450 | 2.2% | Learning |
| Registered Nurses | 7,670 | 2.0% | Learning |
| Rehabilitation Counselors | 7,570 | 1.9% | Iteration |
| Social and Community Service Managers | 7,460 | 1.9% | Iteration |
| Licensed Practical and Licensed Vocational Nurses | 7,140 | 1.8% | Directive |
| General and Operations Managers | 3,960 | 1.0% | Iteration |
| Office Clerks, General | 3,570 | 0.9% | Feedback loop |
| Medical and Health Services Managers | 3,460 | 0.9% | Iteration |
| Maintenance and Repair Workers, General | 3,190 | 0.8% | Learning |
| Secretaries and Administrative Assistants, Except Legal, Medical, and Executive | 3,160 | 0.8% | Directive |
| Human Resources Specialists | 2,160 | 0.5% | Directive |
This rollup is only as complete as the occupation-task matches available for the industry; the coverage figure above is shown so sparse industries do not look falsely precise. AI exposure is not the same as replacement.
Skill & tool metabolism
What this industry's work actually runs on. Each figure is the share of the industry's workers in occupations that significantly rely on a skill, knowledge area, or ability (O*NET importance ≥ 3 of 5), or that use a tool category — its employment reach. This is a measure of how widespread a requirement is across the workforce, not how intensively any one worker uses it. Shares are independent and need not add to 100%.
Based on 29.1% of this industry's employment that maps to a detailed occupation with an O*NET skill profile.
Skills
| Skill | Employment reach | Workers |
|---|---|---|
| Active Listening | 28.7% | 111,650 |
| Speaking | 28.4% | 110,520 |
| Critical Thinking | 27.9% | 108,460 |
| Reading Comprehension | 27.3% | 106,370 |
| Coordination | 27.2% | 105,830 |
| Monitoring | 26.9% | 104,740 |
| Service Orientation | 26.8% | 104,480 |
| Social Perceptiveness | 26.1% | 101,420 |
| Time Management | 25.9% | 100,650 |
| Writing | 24.7% | 96,180 |
| Judgment and Decision Making | 23.7% | 92,270 |
| Complex Problem Solving | 23.0% | 89,520 |
Knowledge areas
| Knowledge area | Employment reach | Workers |
|---|---|---|
| English Language | 28.6% | 111,200 |
| Customer and Personal Service | 27.9% | 108,450 |
| Education and Training | 21.2% | 82,360 |
| Administration and Management | 21.0% | 81,880 |
| Psychology | 18.0% | 70,050 |
| Administrative | 17.9% | 69,560 |
| Therapy and Counseling | 17.4% | 67,660 |
| Computers and Electronics | 15.5% | 60,340 |
| Public Safety and Security | 15.1% | 58,830 |
| Sociology and Anthropology | 13.3% | 51,700 |
| Mathematics | 11.4% | 44,300 |
| Personnel and Human Resources | 11.0% | 42,830 |
Abilities
| Abilitie | Employment reach | Workers |
|---|---|---|
| Near Vision | 29.1% | 113,390 |
| Oral Comprehension | 29.1% | 113,110 |
| Oral Expression | 29.0% | 112,790 |
| Problem Sensitivity | 28.2% | 109,790 |
| Speech Clarity | 28.1% | 109,270 |
| Speech Recognition | 28.1% | 109,580 |
| Information Ordering | 27.9% | 108,560 |
| Deductive Reasoning | 27.7% | 107,920 |
| Inductive Reasoning | 27.7% | 107,890 |
| Written Comprehension | 27.7% | 107,770 |
| Written Expression | 27.3% | 106,100 |
| Category Flexibility | 24.9% | 96,770 |
Tool categories
| Tool category | Employment reach | Workers |
|---|---|---|
| Spreadsheet software | 29.2% | 113,590 |
| Office suite software | 28.6% | 111,150 |
| Electronic mail software | 28.4% | 110,670 |
| Word processing software | 28.4% | 110,550 |
| Internet browser software | 26.1% | 101,460 |
| Data base user interface and query software | 22.8% | 88,630 |
| Presentation software | 22.8% | 88,740 |
| Medical software | 22.2% | 86,520 |
| Accounting software | 14.5% | 56,370 |
| Operating system software | 14.2% | 55,230 |
| Web page creation and editing software | 13.6% | 52,880 |
| Analytical or scientific software | 13.3% | 51,720 |
| Project management software | 13.3% | 51,780 |
| Enterprise resource planning ERP software | 13.1% | 50,860 |
| Calendar and scheduling software | 12.9% | 50,200 |
Reach = share of industry employment in occupations where the requirement is significant; it is not a per-worker usage or proficiency measure. Skill, knowledge, and ability importance is from O*NET; tool use is reported presence of a technology category.
Largest occupations
The occupations that employ the most people in this industry, with their share of the industry's workforce and national median pay for the occupation (not industry-specific pay).
Showing the top 40 of 135 occupations by employment.
Most distinctive occupations
The occupations most unusually concentrated in this industry compared with the economy as a whole. The location quotient is how many times more common an occupation is here versus its economy-wide share (a value of 5 means five times as concentrated).
| Occupation | Concentration | Workers |
|---|---|---|
| Residential Advisors | 46.63× | 9,750 |
| Rehabilitation Counselors | 33.71× | 7,570 |
| Home Health and Personal Care Aides | 26.51× | 266,980 |
| Social and Community Service Managers | 15.11× | 7,460 |
| Psychiatric Technicians | 9.18× | 3,160 |
| Social and Human Service Assistants | 7.89× | 8,450 |
| Psychiatric Aides | 7.6× | 670 |
| Mental Health and Substance Abuse Social Workers | 6.64× | 2,110 |
| Special Education Teachers, All Other | 5.64× | 560 |
| Counselors, All Other | 5.23× | 440 |
| Substance Abuse, Behavioral Disorder, and Mental Health Counselors | 4.68× | 5,200 |
| Licensed Practical and Licensed Vocational Nurses | 4.47× | 7,140 |
| Healthcare Social Workers | 3.81× | 1,790 |
| Personal Care and Service Workers, All Other | 3.3× | 520 |
| Community Health Workers | 2.48× | 380 |
| Medical and Health Services Managers | 2.42× | 3,460 |
| Human Resources Assistants, Except Payroll and Timekeeping | 1.93× | 450 |
| Nursing Assistants | 1.88× | 6,590 |
| Clinical and Counseling Psychologists | 1.81× | 330 |
| Shuttle Drivers and Chauffeurs | 1.71× | 990 |
Write a report on thisheadline · factoids · citation
The Residential Intellectual and Developmental Disability Facilities workforce sits at the 59th percentile of AI task overlap — 389,290 U.S. workers
- Weighting every occupation by its real share of Residential Intellectual and Developmental Disability Facilities employment, the industry's workforce ranks in the 59th percentile (Moderate band) for AI task overlap — overlap with what AI can attempt, not a measure of jobs at risk.Eloundou et al. + Felten AIOE, weighted by BLS OEWS
- The industry employs about 389,290 U.S. workers across 135 occupations.BLS OEWS (May 2024)
- Employment-weighted typical annual pay is about $41,596.BLS OEWS (May 2024)
- Of AI use observed across this industry's occupations, 47% looks like augmentation rather than automation — from a Claude.ai sample, not a census.Anthropic Economic Index
The Residential Intellectual and Developmental Disability Facilities workforce sits at the 59th percentile of AI task overlap — 389,290 U.S. workers

• Weighting every occupation by its real share of Residential Intellectual and Developmental Disability Facilities employment, the industry's workforce ranks in the 59th percentile (Moderate band) for AI task overlap — overlap with what AI can attempt, not a measure of jobs at risk. (Eloundou et al. + Felten AIOE, weighted by BLS OEWS)
• The industry employs about 389,290 U.S. workers across 135 occupations. (BLS OEWS (May 2024))
• Employment-weighted typical annual pay is about $41,596. (BLS OEWS (May 2024))
• Of AI use observed across this industry's occupations, 47% looks like augmentation rather than automation — from a Claude.ai sample, not a census. (Anthropic Economic Index)

Source: Singulariki — "Residential Intellectual and Developmental Disability Facilities". https://singulariki.com/industries/623210
Note: AI task overlap measures what today's AI can attempt, not automation, job loss, or a forecast.
AssetsShare imageMethodology & sourcesPress & newsroomThe newsroom
Every line is built only from figures this page already shows and cites. AI task overlap means what today's AI can attempt — not automation, job loss, or a forecast.
Sources for this page
Every figure above traces to a named public dataset and the exact release below — not hand-written opinion. See the full methodology for what each measure does and does not mean.
- O*NET 30.3 U.S. Department of Labor / National Center for O*NET Development
- BLS Occupational Employment and Wage Statistics (OEWS) May 2024 U.S. Bureau of Labor Statistics
- Census NAICS 2022 U.S. Census Bureau
- Anthropic Economic Index v4 (2026-01-15) + v2 (2025-03-27) Anthropic
- “GPTs are GPTs” (Eloundou et al.) arXiv 2303.10130 OpenAI / academic
- AI Occupational Exposure (AIOE) Felten, Raj & Seamans academic
Data compiled June 3, 2026. Figures are estimates, not advice.
Cite this page
Singulariki. "Residential Intellectual and Developmental Disability Facilities." Singulariki: a source-backed encyclopedia of work. Built from O*NET 30.3; BLS Occupational Employment and Wage Statistics (OEWS) May 2024; Census NAICS 2022; Anthropic Economic Index v4 (2026-01-15) + v2 (2025-03-27); “GPTs are GPTs” (Eloundou et al.) arXiv 2303.10130; AI Occupational Exposure (AIOE) Felten, Raj & Seamans. Accessed June 7, 2026. https://singulariki.com/industries/623210
Singulariki. (2026). Residential Intellectual and Developmental Disability Facilities. Singulariki: a source-backed encyclopedia of work. Retrieved June 7, 2026, from https://singulariki.com/industries/623210
@misc{singulariki-623210,
  title  = {Residential Intellectual and Developmental Disability Facilities},
  author = {{Singulariki}},
  year   = {2026},
  note   = {O*NET 30.3; BLS Occupational Employment and Wage Statistics (OEWS) May 2024; Census NAICS 2022; Anthropic Economic Index v4 (2026-01-15) + v2 (2025-03-27); “GPTs are GPTs” (Eloundou et al.) arXiv 2303.10130; AI Occupational Exposure (AIOE) Felten, Raj & Seamans. Accessed June 7, 2026},
  url    = {https://singulariki.com/industries/623210}
} Citations name the underlying public dataset releases — they reflect what this page is built from, not just the URL.