Other Services (except Public Administration)
Sector · NAICS 81
A source-stamped Markdown brief of this occupation — paste it into an agent, or fetch
/industries/81/context.md directly.
Other Services (except Public Administration) is a U.S. industry in the NAICS classification. The Bureau of Labor Statistics estimates about 4,426,400 workers across 556 detailed occupations in it. A typical worker earns around $50,697 a year (Singulariki estimate, see below).
The Sector as a Whole The Other Services (except Public Administration) sector comprises establishments engaged in providing services not specifically provided for elsewhere in the classification system. Establishments in this sector are primarily engaged in activities such as equipment and machinery repairing, promoting or administering religious activities, grantmaking, advocacy, and providing drycleaning and laundry services, personal care services, death care services, pet care (except veterinary) services, photofinishing services, temporary parking services, and dating services. Private households that engage in employing workers on or about the premises in activities primarily concerned with the operation of the household are included in this sector. Excluded from this sector are establishments primarily engaged in retailing new equipment and also performing repairs and general maintenance on equipment. These establishments are classified in Sector 44-45, Retail Trade.
Employment is national May 2024 OEWS. "Typical pay" is Singulariki's own figure — the employment-weighted average of each occupation's national median wage — a rough center of the industry, not an official BLS number.
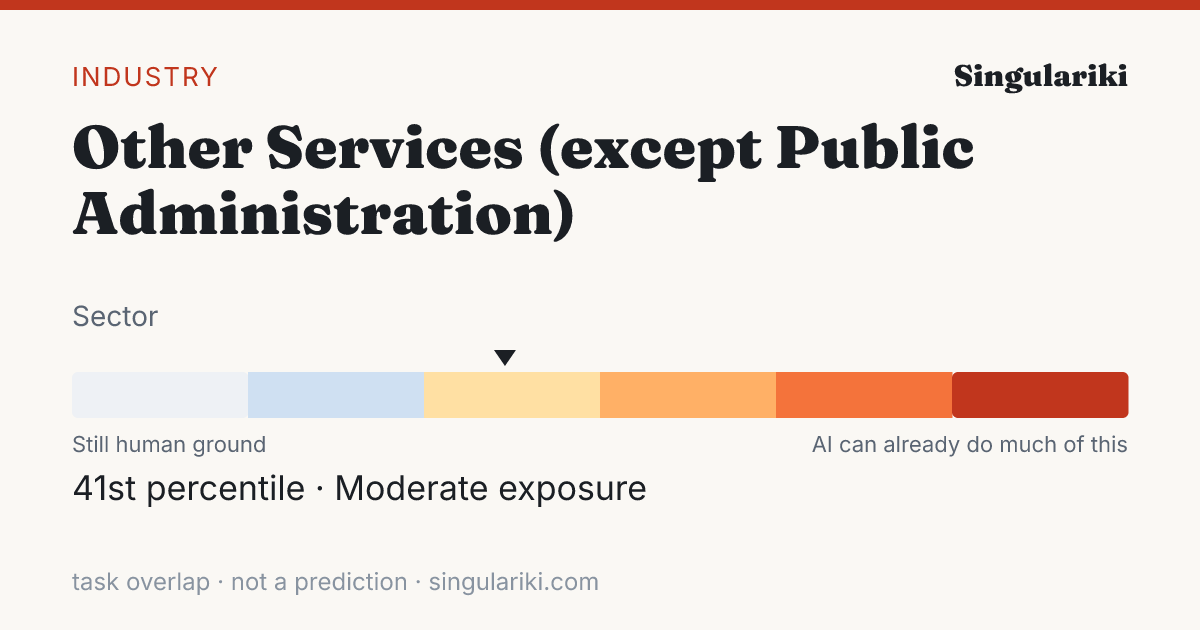
How exposed this industry is to AI
Weighting every occupation in this industry by its employment and its unified AI-exposure index (the OpenAI "GPTs are GPTs" human-rated task overlap folded with the Felten/Raj/Seamans AIOE index), this industry sits in the Moderate band — 41st percentile across all industries.
Exposure measures how much of the work overlaps with what today's AI can do, not a prediction of automation; high-exposure industries are where AI is most likely to reshape tasks. Employment-weighted across 464 occupations that carry an exposure score. Compare every industry on the AI exposure hub.
How AI is actually used in this industry
Among measured Claude.ai (Free and Pro) conversations mapped to O*NET task statements (Anthropic Economic Index, 2026-01-15), these patterns are most associated with the occupations in this industry, weighted by its employment mix. They are shares of observed AI conversations — not of worker time, revenue, or what could be automated — and reflect one AI assistant's consumer sample, not all AI.
| Signal coverage | 66.5% of employment · 288/506 occupations have AEI task data |
| Augmentation vs. automation | 45.4% working with AI · 34.7% handed to AI |
| Most common pattern | Directive · AI does it; you give the instruction |
| Typical AI autonomy | 3.5 / 5 · higher = AI acts more independently |
Tasks driving the signal
The task families that account for the most AI activity across this industry's occupations (employment × observed usage), each attributed to the occupation it comes from.
| Task | Occupation | How | Share of signal |
|---|---|---|---|
| Troubleshoot problems involving office equipment, such as computer hardware and software. | Office Clerks, General | Feedback loop | 28.4% |
| Use computers for various applications, such as database management or word processing. | Secretaries and Administrative Assistants, Except Legal, Medical, and Executive | Directive | 5.2% |
| Conduct searches to find needed information, using such sources as the Internet. | Secretaries and Administrative Assistants, Except Legal, Medical, and Executive | Directive | 4.8% |
| Develop or maintain internal or external company Web sites. | Secretaries and Administrative Assistants, Except Legal, Medical, and Executive | Directive | 3.6% |
| Answer customers' questions, and provide information on procedures or policies. | Cashiers | Directive | 2.8% |
| Prepare or edit organizational publications, such as employee newsletters or stockholders' reports, for internal or external audiences. | Public Relations Specialists | Iteration | 1.8% |
| Prepare, rewrite and edit copy to improve readability, or supervise others who do this work. | Editors | Iteration | 1.5% |
| Read from sacred texts such as the Bible, Torah, or Koran. | Clergy | Learning | 1.4% |
| Analyze patrons' hair and other physical features to determine and recommend beauty treatment or suggest hair styles. | Hairdressers, Hairstylists, and Cosmetologists | Iteration | 1.4% |
| Participate in the work of subordinates to facilitate productivity or to overcome difficult aspects of work. | First-Line Supervisors of Office and Administrative Support Workers | Iteration | 1.4% |
| Process and prepare documents, such as business or government forms and expense reports. | Office Clerks, General | Directive | 1.1% |
| Conduct classes, workshops, and demonstrations, and provide individual instruction to teach topics and skills such as cooking, dancing, writing, physical fitness, photography, personal finance, and flying. | Self-Enrichment Teachers | Learning | 1.1% |
Occupations behind the signal
The occupations whose AI-touched tasks contribute most to this industry's signal, by employment here.
| Occupation | Workers | Share | How they use AI |
|---|---|---|---|
| Hairdressers, Hairstylists, and Cosmetologists | 261,290 | 5.9% | Iteration |
| Automotive Service Technicians and Mechanics | 242,800 | 5.5% | Learning |
| General and Operations Managers | 223,260 | 5.0% | Iteration |
| Office Clerks, General | 121,170 | 2.7% | Feedback loop |
| Receptionists and Information Clerks | 109,250 | 2.5% | Directive |
| Secretaries and Administrative Assistants, Except Legal, Medical, and Executive | 98,010 | 2.2% | Directive |
| Parking Attendants | 73,190 | 1.7% | Directive |
| Customer Service Representatives | 68,730 | 1.6% | Directive |
| First-Line Supervisors of Mechanics, Installers, and Repairers | 63,560 | 1.4% | Directive |
| Bookkeeping, Accounting, and Auditing Clerks | 62,890 | 1.4% | Directive |
| Maintenance and Repair Workers, General | 53,520 | 1.2% | Learning |
| Industrial Machinery Mechanics | 52,870 | 1.2% | Directive |
This rollup is only as complete as the occupation-task matches available for the industry; the coverage figure above is shown so sparse industries do not look falsely precise. AI exposure is not the same as replacement.
Skill & tool metabolism
What this industry's work actually runs on. Each figure is the share of the industry's workers in occupations that significantly rely on a skill, knowledge area, or ability (O*NET importance ≥ 3 of 5), or that use a tool category — its employment reach. This is a measure of how widespread a requirement is across the workforce, not how intensively any one worker uses it. Shares are independent and need not add to 100%.
Based on 94.6% of this industry's employment that maps to a detailed occupation with an O*NET skill profile.
Skills
| Skill | Employment reach | Workers |
|---|---|---|
| Active Listening | 87.4% | 3,867,850 |
| Speaking | 81.3% | 3,599,170 |
| Critical Thinking | 72.5% | 3,208,080 |
| Monitoring | 72.1% | 3,193,010 |
| Social Perceptiveness | 66.0% | 2,919,230 |
| Time Management | 65.6% | 2,902,350 |
| Service Orientation | 63.6% | 2,817,180 |
| Reading Comprehension | 62.8% | 2,779,470 |
| Judgment and Decision Making | 57.9% | 2,564,970 |
| Complex Problem Solving | 53.4% | 2,365,690 |
| Coordination | 53.4% | 2,364,440 |
| Writing | 44.9% | 1,986,550 |
Knowledge areas
| Knowledge area | Employment reach | Workers |
|---|---|---|
| Customer and Personal Service | 85.3% | 3,777,030 |
| English Language | 70.0% | 3,099,210 |
| Administration and Management | 47.9% | 2,121,800 |
| Administrative | 40.4% | 1,786,250 |
| Computers and Electronics | 36.0% | 1,592,090 |
| Mathematics | 31.1% | 1,374,980 |
| Sales and Marketing | 21.0% | 930,970 |
| Mechanical | 19.8% | 875,280 |
| Education and Training | 19.6% | 866,480 |
| Production and Processing | 17.8% | 787,630 |
| Public Safety and Security | 17.1% | 756,930 |
| Personnel and Human Resources | 17.0% | 752,430 |
Abilities
| Abilitie | Employment reach | Workers |
|---|---|---|
| Near Vision | 94.5% | 4,184,430 |
| Oral Expression | 88.6% | 3,921,470 |
| Oral Comprehension | 86.5% | 3,829,150 |
| Problem Sensitivity | 83.5% | 3,695,810 |
| Speech Recognition | 80.3% | 3,552,400 |
| Information Ordering | 77.0% | 3,407,410 |
| Deductive Reasoning | 72.4% | 3,206,310 |
| Speech Clarity | 72.0% | 3,188,100 |
| Written Comprehension | 70.3% | 3,109,710 |
| Inductive Reasoning | 68.4% | 3,028,750 |
| Category Flexibility | 59.0% | 2,610,910 |
| Selective Attention | 56.7% | 2,511,460 |
Tool categories
| Tool category | Employment reach | Workers |
|---|---|---|
| Spreadsheet software | 91.0% | 4,026,700 |
| Office suite software | 87.3% | 3,863,930 |
| Word processing software | 83.9% | 3,713,980 |
| Data base user interface and query software | 81.9% | 3,624,900 |
| Electronic mail software | 75.3% | 3,334,140 |
| Operating system software | 58.6% | 2,595,950 |
| Presentation software | 55.3% | 2,445,890 |
| Internet browser software | 55.2% | 2,443,370 |
| Calendar and scheduling software | 48.7% | 2,155,550 |
| Enterprise resource planning ERP software | 44.8% | 1,983,430 |
| Project management software | 41.4% | 1,834,730 |
| Web page creation and editing software | 40.2% | 1,781,130 |
| Accounting software | 39.7% | 1,756,550 |
| Customer relationship management CRM software | 34.7% | 1,533,910 |
| Document management software | 34.4% | 1,522,250 |
Reach = share of industry employment in occupations where the requirement is significant; it is not a per-worker usage or proficiency measure. Skill, knowledge, and ability importance is from O*NET; tool use is reported presence of a technology category.
Largest occupations
The occupations that employ the most people in this industry, with their share of the industry's workforce and national median pay for the occupation (not industry-specific pay).
Showing the top 40 of 556 occupations by employment.
Most distinctive occupations
The occupations most unusually concentrated in this industry compared with the economy as a whole. The location quotient is how many times more common an occupation is here versus its economy-wide share (a value of 5 means five times as concentrated).
For a sector this broad, the location quotient has a ceiling set by the sector's own share of national employment, so the top values tend to cluster near that limit.
| Occupation | Concentration | Workers |
|---|---|---|
| Funeral Home Managers | 34.59× | 13,030 |
| Funeral Attendants | 34.54× | 30,300 |
| Morticians, Undertakers, and Funeral Arrangers | 34.37× | 25,360 |
| Manicurists and Pedicurists | 34.37× | 145,870 |
| Shampooers | 34.25× | 8,740 |
| Embalmers | 34.02× | 3,340 |
| Barbers | 33.99× | 17,660 |
| Crematory Operators | 32.94× | 2,790 |
| Hairdressers, Hairstylists, and Cosmetologists | 30.8× | 261,290 |
| Pressers, Textile, Garment, and Related Materials | 30.59× | 23,560 |
| Automotive Glass Installers and Repairers | 30.18× | 16,410 |
| Religious Workers, All Other | 30× | 10,480 |
| Directors, Religious Activities and Education | 27.69× | 17,060 |
| Labor Relations Specialists | 27.29× | 50,610 |
| Skincare Specialists | 25.72× | 51,870 |
| Automotive Body and Related Repairers | 25.01× | 111,450 |
| Animal Caretakers | 19.4× | 154,470 |
| Parking Attendants | 18.93× | 73,190 |
| Massage Therapists | 18.2× | 50,170 |
| Laundry and Dry-Cleaning Workers | 17.28× | 96,930 |
Sub-industries
More detailed industries within Other Services (except Public Administration).
Write a report on thisheadline · factoids · citation
The Other Services (except Public Administration) workforce sits at the 41st percentile of AI task overlap — 4,426,400 U.S. workers
- Weighting every occupation by its real share of Other Services (except Public Administration) employment, the industry's workforce ranks in the 41st percentile (Moderate band) for AI task overlap — overlap with what AI can attempt, not a measure of jobs at risk.Eloundou et al. + Felten AIOE, weighted by BLS OEWS
- The industry employs about 4,426,400 U.S. workers across 556 occupations.BLS OEWS (May 2024)
- Employment-weighted typical annual pay is about $50,697.BLS OEWS (May 2024)
- Of AI use observed across this industry's occupations, 45% looks like augmentation rather than automation — from a Claude.ai sample, not a census.Anthropic Economic Index
The Other Services (except Public Administration) workforce sits at the 41st percentile of AI task overlap — 4,426,400 U.S. workers

• Weighting every occupation by its real share of Other Services (except Public Administration) employment, the industry's workforce ranks in the 41st percentile (Moderate band) for AI task overlap — overlap with what AI can attempt, not a measure of jobs at risk. (Eloundou et al. + Felten AIOE, weighted by BLS OEWS)
• The industry employs about 4,426,400 U.S. workers across 556 occupations. (BLS OEWS (May 2024))
• Employment-weighted typical annual pay is about $50,697. (BLS OEWS (May 2024))
• Of AI use observed across this industry's occupations, 45% looks like augmentation rather than automation — from a Claude.ai sample, not a census. (Anthropic Economic Index)

Source: Singulariki — "Other Services (except Public Administration)". https://singulariki.com/industries/81
Note: AI task overlap measures what today's AI can attempt, not automation, job loss, or a forecast.
AssetsShare imageMethodology & sourcesPress & newsroomThe newsroom
Every line is built only from figures this page already shows and cites. AI task overlap means what today's AI can attempt — not automation, job loss, or a forecast.
Sources for this page
Every figure above traces to a named public dataset and the exact release below — not hand-written opinion. See the full methodology for what each measure does and does not mean.
- O*NET 30.3 U.S. Department of Labor / National Center for O*NET Development
- BLS Occupational Employment and Wage Statistics (OEWS) May 2024 U.S. Bureau of Labor Statistics
- Census NAICS 2022 U.S. Census Bureau
- Anthropic Economic Index v4 (2026-01-15) + v2 (2025-03-27) Anthropic
- “GPTs are GPTs” (Eloundou et al.) arXiv 2303.10130 OpenAI / academic
- AI Occupational Exposure (AIOE) Felten, Raj & Seamans academic
Data compiled June 3, 2026. Figures are estimates, not advice.
Cite this page
Singulariki. "Other Services (except Public Administration)." Singulariki: a source-backed encyclopedia of work. Built from O*NET 30.3; BLS Occupational Employment and Wage Statistics (OEWS) May 2024; Census NAICS 2022; Anthropic Economic Index v4 (2026-01-15) + v2 (2025-03-27); “GPTs are GPTs” (Eloundou et al.) arXiv 2303.10130; AI Occupational Exposure (AIOE) Felten, Raj & Seamans. Accessed June 7, 2026. https://singulariki.com/industries/81
Singulariki. (2026). Other Services (except Public Administration). Singulariki: a source-backed encyclopedia of work. Retrieved June 7, 2026, from https://singulariki.com/industries/81
@misc{singulariki-81,
  title  = {Other Services (except Public Administration)},
  author = {{Singulariki}},
  year   = {2026},
  note   = {O*NET 30.3; BLS Occupational Employment and Wage Statistics (OEWS) May 2024; Census NAICS 2022; Anthropic Economic Index v4 (2026-01-15) + v2 (2025-03-27); “GPTs are GPTs” (Eloundou et al.) arXiv 2303.10130; AI Occupational Exposure (AIOE) Felten, Raj & Seamans. Accessed June 7, 2026},
  url    = {https://singulariki.com/industries/81}
} Citations name the underlying public dataset releases — they reflect what this page is built from, not just the URL.