Conduct research using bioinformatics theory and methods in areas such as pharmaceuticals, medical technology, biotechnology, computational biology, proteomics, computer information science, biology and medical informatics. May design databases and develop algorithms for processing and analyzing genomic information, or other biological information.
Also called: Bioinformaticist · Bioinformatics Scientist · Research Scientist · Scientist · Research Associate · Scientific Database Curator · Bioinformatician · Bioinformatics Analyst · Bioinformatics Associate · Bioinformatics Computer Scientist · Bioinformatics Consultant · Bioinformatics Data Analyst
A source-stamped Markdown brief of this occupation — paste it into an agent, or fetch
/roles/role-19-1029-01/context.md directly.
AI work map
A fast read on where AI already shows up in this occupation, where it stays a copilot,
where humans remain in the loop, and what the labor market is doing. Built from observed
Claude.ai conversations mapped to O*NET tasks and from published research — measures of
usage and exposure, not advice or predictions that the job is going away.
Often handed to AI
Task areas most often handled directively in observed AI conversations —
candidates to delegate with light review.
Develop new software applications or customize existing applications to meet specific scientific project needs. · 31.2%
Analyze large molecular datasets such as raw microarray data, genomic sequence data, and proteomics data for clinical or basic research purposes. · 3.8%
Provide statistical and computational tools for biologically based activities such as genetic analysis, measurement of gene expression, and gene function determination. · 1.7%
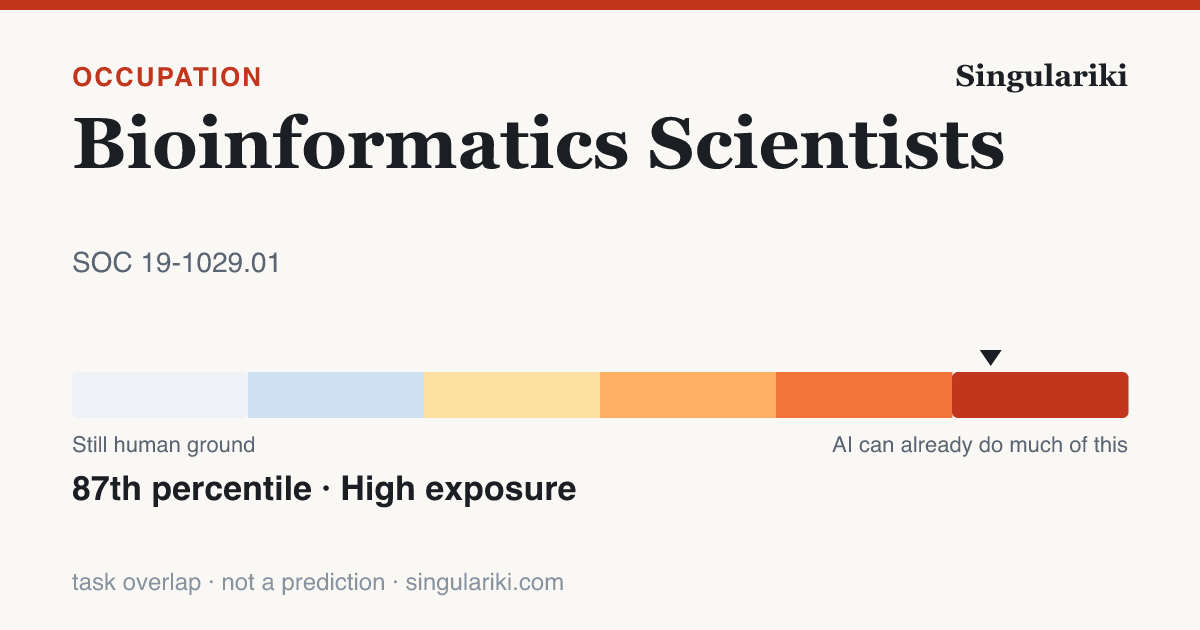
↔87th-percentile task overlap — yet
about 4,800 openings a year
(+1.2% projected, BLS), and
observed AI use leans 4454% copilot, not hand-off (AEI)
. What exposure means →
AI & job outlook
What today's research says about this occupation's exposure to AI, how AI is
actually being used in it, and where employment is headed. These are positions
within published studies — measures of exposure and usage, not predictions
that this job will disappear.
Exposure to current AI
Each study uses its own scale, so the raw scores are not comparable across rows —
the percentile (this job's rank among all U.S. occupations with
data) is the comparable figure, and sizes the bars.
Measure
Rank vs all occupations
Percentile
Score
Overall AI exposure (Felten et al.) High
74th
1.0
LLM task exposure, γ (OpenAI / Eloundou) High
95th
1.0
AI assistant applicability (Microsoft) High
77th
0.2
OpenAI's exposure study scores tasks three ways: with a language model alone
(α 0.4), with simple added tooling
(β 0.7), and including AI-powered software
(γ 1.0). Higher means more of the job's
tasks could be done at least twice as fast — not that they will be automated away.
Most of this job's tasks can be done remotely (Dingel–Neiman), which tends to track with higher digital and AI exposure.
Historical automation estimate (2013)
A pre-LLM (2013) estimate of how automatable this job is by computerization and robotics. Shown for historical context only — it is not part of any current AI ranking.
Frey–Osborne probability 0.0 ·
11th percentile among occupations ·
Low
How AI is actually used in this job
Among measured AI assistant conversations mapped to this occupation (Anthropic
Economic Index, 2026-01-15), these
task types came up most. These are shares of observed AI conversations —
not shares of the job, of worker time, or of what could be automated.
Develop data models and databases.
10.1%
Develop new software applications or customize existing applications to meet specific scientific project needs.
9.1%
Communicate research results through conference presentations, scientific publications, or project reports.
2.8%
Manipulate publicly accessible, commercial, or proprietary genomic, proteomic, or post-genomic databases.
2.2%
Consult with researchers to analyze problems, recommend technology-based solutions, or determine computational strategies.
1.8%
Create or modify web-based bioinformatics tools.
1.7%
Job outlook
Independent U.S. Bureau of Labor Statistics employment projection for 2024–2034 —
a labor-market forecast, not an AI-impact forecast.
Outlook
About average · +1.2% by 2034
Projected annual openings
4,800
Employment 2024 → 2034
63,700 → 64,500
“Annual openings” counts new jobs plus replacements for workers who leave the
occupation, so it can be large even when growth is modest.
Where this work sits on the global GenAI gradient
The ILO's 2025 global study scores generative-AI exposure on the international ISCO-08
occupation system, not US SOC. Bridged through the published (and approximate,
many-to-many) IBS O*NET-SOC ↔ ISCO-08 crosswalk, this US occupation corresponds to the
international occupation below. Exposure here means how much of the work's tasks today's AI can attempt — task
overlap, not automation, adoption, or jobs lost.
Bioinformatics Scientists sits at the 77th percentile of 427
occupations on the global GenAI task-exposure gradient
— exposure rose from 2023 to 2025. Each dot is one occupation; the
ringed one is this work. Exposure is task overlap, not automation or jobs lost.
Read the whole six-band gradient on the GenAI exposure gradient page.
The crosswalk is approximate: a US occupation can map to several international ones, and the
ILO scores describe the international occupation, not this exact US role.
Working with AI in this job
How people actually apply AI to this occupation's tasks, from Claude.ai (Free and Pro) conversations in the Anthropic Economic
Index, 2026-01-15. This is one AI
assistant's consumer sample — not all AI, not the whole workforce. Autonomy and the
collaboration mix are model-rated estimates; figures below the sample floor are hidden.
Augmentation vs. automation
44.5% working with AI · 48.5% handed to AI
Most common way people use AI here
Directive · AI does it; you give the instruction
Typical AI autonomy
4.0 / 5
· higher = AI acts more independently
Used for work (vs. personal / coursework)
55.5%
What people delegate to AI
The role's most common tasks in AI conversations, each tagged with how people work
with the AI on it. “Usage” is the share of observed conversations, not of
the job.
Task
How
Usage
Develop new software applications or customize existing applications to meet specific scientific project needs.
Directive
31.2%
Analyze large molecular datasets such as raw microarray data, genomic sequence data, and proteomics data for clinical or basic research purposes.
Feedback loop
3.8%
Instruct others in the selection and use of bioinformatics tools.
Learning
2.6%
Provide statistical and computational tools for biologically based activities such as genetic analysis, measurement of gene expression, and gene function determination.
Directive
1.7%
Develop data models and databases.
Directive
1.4%
Consult with researchers to analyze problems, recommend technology-based solutions, or determine computational strategies.
Learning
1.4%
Communicate research results through conference presentations, scientific publications, or project reports.
Learning
1.3%
Design and apply bioinformatics algorithms including unsupervised and supervised machine learning, dynamic programming, or graphic algorithms.
Iteration
0.7%
Where a human is still needed
Tasks where the model most often judged that a person remained necessary — a useful
read on the current boundary, not a guarantee.
Recommend new systems and processes to improve operations.
97.4%
Consult with researchers to analyze problems, recommend technology-based solutions, or determine computational strategies.
95.0%
Prepare summary statistics of information regarding human genomes.
91.9%
Develop data models and databases.
89.9%
Instruct others in the selection and use of bioinformatics tools.
89.2%
Communicate research results through conference presentations, scientific publications, or project reports.
88.5%
What people most often hand AI here
Example prompts phrased from the tasks people most often delegate to AI in this
occupation (Anthropic Economic Index). Each shows the underlying measured task and its
share of observed AI use. They are suggested phrasings of real tasks — starting points,
not endorsed instructions.
Help me develop new software applications or customize existing applications to meet specific scientific project needs.
From: Develop new software applications or customize existing applications to meet specific scientific project needs. · 31.2% of measured AI use · directive
Help me analyze large molecular datasets such as raw microarray data, genomic sequence data, and proteomics data for clinical or basic research purposes.
From: Analyze large molecular datasets such as raw microarray data, genomic sequence data, and proteomics data for clinical or basic research purposes. · 3.8% of measured AI use · feedback loop
Help me instruct others in the selection and use of bioinformatics tools.
From: Instruct others in the selection and use of bioinformatics tools. · 2.6% of measured AI use · learning
Help me provide statistical and computational tools for biologically based activities such as genetic analysis, measurement of gene expression, and gene function determination.
From: Provide statistical and computational tools for biologically based activities such as genetic analysis, measurement of gene expression, and gene function determination. · 1.7% of measured AI use · directive
Tasks
All 20 tasks O*NET lists for this occupation, ordered by importance.
Each links to its own page with AI-exposure and observed-use detail.
How characteristic each condition is of the job, on O*NET's 1–5 context scale
(higher = more present in day-to-day work). Each condition links to how it varies
across all occupations.
Most of these occupations require graduate school. For example, they may require a master's degree, and some require a Ph.D., M.D., or J.D. (law degree).
Extensive skill, knowledge, and experience are needed for these occupations. Many require more than five years of experience. For example, surgeons must complete four years of college and an additional five to seven years of specialized medical training to be able to do their job.
Preparation level
SVP (8.0 and above) — total schooling plus on-the-job experience.
Annual wages by percentile — U.S. (BLS OEWS). The light
band spans the 10th–90th percentile; the darker band is the middle half (25th–75th); the line
is the median.
Projected U.S. employment, 2024–2034 (BLS Employment Projections). A labor-market forecast for
the occupation, not an AI-impact forecast.
10th percentile
$54,500
25th percentile
$67,950
Median (50th)
$93,330
75th percentile
$121,350
90th percentile
$159,780
People employed
59,710
Wages and employment are reported by BLS for the broader occupation group this
specialty belongs to (SOC 19-1029), not for the specialty alone.
Industries that employ this occupation
Where these workers are employed, by number of jobs (national, BLS OEWS). Pay shown is
the occupation's national median, not industry-specific.
Industries where this occupation is far more common than in the economy as a whole.
The location quotient is how many times more concentrated it is here (a value of 5
means five times its economy-wide share).
AI task-overlap percentile (horizontal) vs. median-pay percentile (vertical), across all scored occupations. This occupation is highlighted; related occupations are plotted alongside it. Overlap measures shared tasks with AI, not automation.
▸Write a report on thisheadline · factoids · citation
Bioinformatics Scientists show 87th-percentile AI task overlap — and about 4,800 annual U.S. openings
Bioinformatics Scientists rank in the 87th percentile (High band) for AI task overlap across U.S. occupations — a measure of how much of the work today's AI can attempt, not how much is automated.Eloundou et al. (GPTs are GPTs) + Felten AIOE
The occupation is projected to see about 4,800 U.S. job openings per year (2024–34), counting growth and replacement — a labor-demand projection made independently of AI.BLS Employment Projections 2024–34
BLS projects employment to be about average (+1.2%) from 2024 to 2034.BLS Employment Projections 2024–34
Median annual pay is $93,330, across about 59,710 U.S. workers.BLS OEWS (May 2024)
Of the AI use actually observed for this work, 45% looks like augmentation (drafting, iterating, checking) rather than hands-off automation — from a Claude.ai usage sample, not a census.2026-01-15-v4-plus-2025-03-27-v2
Copy the whole kit
Bioinformatics Scientists show 87th-percentile AI task overlap — and about 4,800 annual U.S. openings

• Bioinformatics Scientists rank in the 87th percentile (High band) for AI task overlap across U.S. occupations — a measure of how much of the work today's AI can attempt, not how much is automated. (Eloundou et al. (GPTs are GPTs) + Felten AIOE)
• The occupation is projected to see about 4,800 U.S. job openings per year (2024–34), counting growth and replacement — a labor-demand projection made independently of AI. (BLS Employment Projections 2024–34)
• BLS projects employment to be about average (+1.2%) from 2024 to 2034. (BLS Employment Projections 2024–34)
• Median annual pay is $93,330, across about 59,710 U.S. workers. (BLS OEWS (May 2024))
• Of the AI use actually observed for this work, 45% looks like augmentation (drafting, iterating, checking) rather than hands-off automation — from a Claude.ai usage sample, not a census. (2026-01-15-v4-plus-2025-03-27-v2)

Source: Singulariki — "Bioinformatics Scientists". https://singulariki.com/roles/role-19-1029-01
Note: AI task overlap measures what today's AI can attempt, not automation, job loss, or a forecast.
Every line is built only from figures this page already shows and cites. AI task overlap means
what today's AI can attempt — not automation, job loss, or a forecast.
Sources for this page
Every figure above traces to a named public dataset and the exact release below — not
hand-written opinion. See the full methodology for what each
measure does and does not mean.
O*NET 30.3U.S. Department of Labor / National Center for O*NET Development
Data compiled June 2, 2026. Figures are estimates, not advice.
Cite this page
Plain
Singulariki. "Bioinformatics Scientists." Singulariki: a source-backed encyclopedia of work. Built from O*NET 30.3; BLS Occupational Employment and Wage Statistics (OEWS) May 2024; BLS Employment Projections 2024–2034; Anthropic Economic Index v4 (2026-01-15) + v2 (2025-03-27); Microsoft “Working with AI” working-with-ai; “GPTs are GPTs” (Eloundou et al.) arXiv 2303.10130; AI Occupational Exposure (AIOE) Felten, Raj & Seamans; ILO / Gmyrek et al. GenAI exposure gradient 2025; IBS O*NET-SOC ↔ ISCO-08 occupation crosswalk 2022; Frey & Osborne (2013) frey-osborne-automation; Dingel & Neiman (2020) dingel-neiman-workathome. Accessed June 7, 2026. https://singulariki.com/roles/role-19-1029-01
APA
Singulariki. (2026). Bioinformatics Scientists. Singulariki: a source-backed encyclopedia of work. Retrieved June 7, 2026, from https://singulariki.com/roles/role-19-1029-01
BibTeX
@misc{singulariki-role-19-1029-01,
  title  = {Bioinformatics Scientists},
  author = {{Singulariki}},
  year   = {2026},
  note   = {O*NET 30.3; BLS Occupational Employment and Wage Statistics (OEWS) May 2024; BLS Employment Projections 2024–2034; Anthropic Economic Index v4 (2026-01-15) + v2 (2025-03-27); Microsoft “Working with AI” working-with-ai; “GPTs are GPTs” (Eloundou et al.) arXiv 2303.10130; AI Occupational Exposure (AIOE) Felten, Raj & Seamans; ILO / Gmyrek et al. GenAI exposure gradient 2025; IBS O*NET-SOC ↔ ISCO-08 occupation crosswalk 2022; Frey & Osborne (2013) frey-osborne-automation; Dingel & Neiman (2020) dingel-neiman-workathome. Accessed June 7, 2026},
  url    = {https://singulariki.com/roles/role-19-1029-01}
}
Citations name the underlying public dataset releases — they reflect what this page is built from, not just the URL.
Embed this chart
Paste this into any page. It links back here for attribution.