Insurance Agencies and Brokerages
National industry · NAICS 524210
A source-stamped Markdown brief of this occupation — paste it into an agent, or fetch
/industries/524210/context.md directly.
Insurance Agencies and Brokerages is a U.S. industry in the NAICS classification. The Bureau of Labor Statistics estimates about 990,240 workers across 145 detailed occupations in it. A typical worker earns around $70,355 a year (Singulariki estimate, see below).
This industry comprises establishments primarily engaged in acting as agents (i.e., brokers) in selling annuities and insurance policies. Cross-References. Establishments primarily engaged in--
Employment is national May 2024 OEWS. "Typical pay" is Singulariki's own figure — the employment-weighted average of each occupation's national median wage — a rough center of the industry, not an official BLS number.
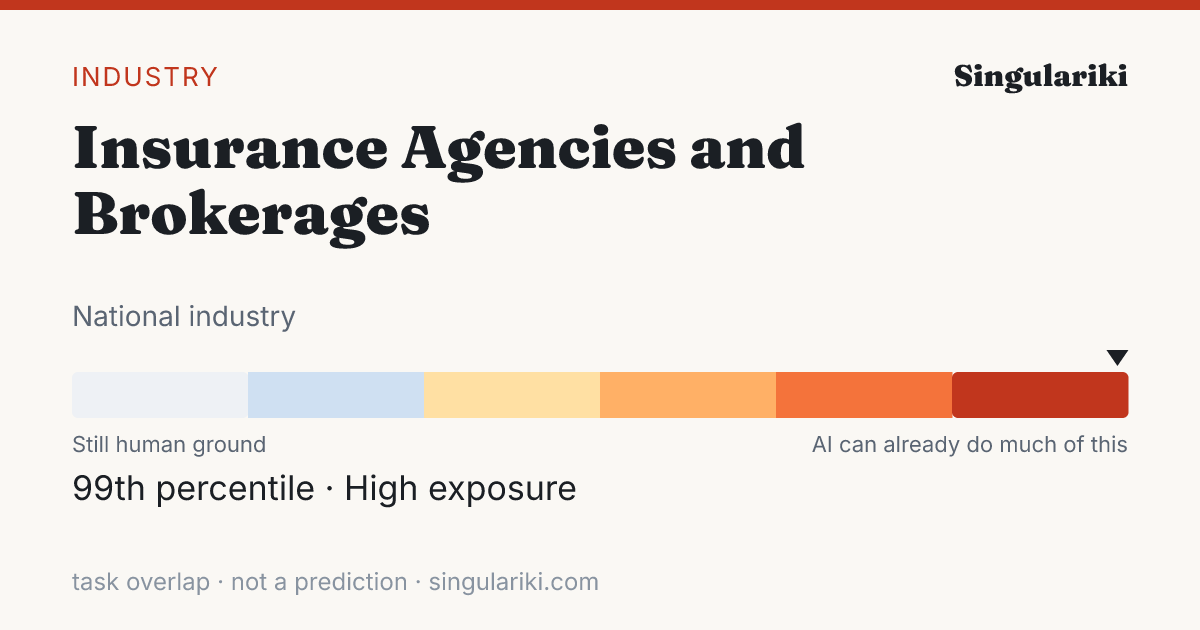
How exposed this industry is to AI
Weighting every occupation in this industry by its employment and its unified AI-exposure index (the OpenAI "GPTs are GPTs" human-rated task overlap folded with the Felten/Raj/Seamans AIOE index), this industry sits in the High band — 99th percentile across all industries.
Exposure measures how much of the work overlaps with what today's AI can do, not a prediction of automation; high-exposure industries are where AI is most likely to reshape tasks. Employment-weighted across 119 occupations that carry an exposure score. Compare every industry on the AI exposure hub.
How AI is actually used in this industry
Among measured Claude.ai (Free and Pro) conversations mapped to O*NET task statements (Anthropic Economic Index, 2026-01-15), these patterns are most associated with the occupations in this industry, weighted by its employment mix. They are shares of observed AI conversations — not of worker time, revenue, or what could be automated — and reflect one AI assistant's consumer sample, not all AI.
| Signal coverage | 94.7% of employment · 92/127 occupations have AEI task data |
| Augmentation vs. automation | 49.3% working with AI · 33.1% handed to AI |
| Most common pattern | Directive · AI does it; you give the instruction |
| Typical AI autonomy | 3.2 / 5 · higher = AI acts more independently |
Tasks driving the signal
The task families that account for the most AI activity across this industry's occupations (employment × observed usage), each attributed to the occupation it comes from.
| Task | Occupation | How | Share of signal |
|---|---|---|---|
| Troubleshoot problems involving office equipment, such as computer hardware and software. | Office Clerks, General | Feedback loop | 28.9% |
| Use computers for various applications, such as database management or word processing. | Secretaries and Administrative Assistants, Except Legal, Medical, and Executive | Directive | 4.0% |
| Conduct searches to find needed information, using such sources as the Internet. | Secretaries and Administrative Assistants, Except Legal, Medical, and Executive | Directive | 3.6% |
| Participate in the work of subordinates to facilitate productivity or to overcome difficult aspects of work. | First-Line Supervisors of Office and Administrative Support Workers | Iteration | 3.0% |
| Keep records of customer interactions or transactions, recording details of inquiries, complaints, or comments, as well as actions taken. | Customer Service Representatives | Directive | 2.9% |
| Develop or maintain internal or external company Web sites. | Secretaries and Administrative Assistants, Except Legal, Medical, and Executive | Directive | 2.7% |
| Interview prospective clients to obtain data about their financial resources and needs, the physical condition of the person or property to be insured, and to discuss any existing coverage. | Insurance Sales Agents | Directive | 2.6% |
| Confer with customers by telephone or in person to provide information about products or services, take or enter orders, cancel accounts, or obtain details of complaints. | Customer Service Representatives | Directive | 2.5% |
| Compose business correspondence for supervisors, managers, and professionals. | Insurance Claims and Policy Processing Clerks | Iteration | 2.5% |
| Customize insurance programs to suit individual customers, often covering a variety of risks. | Insurance Sales Agents | Iteration | 2.4% |
| Explain necessary bookkeeping requirements for customer to implement and provide group insurance program. | Insurance Sales Agents | Learning | 2.2% |
| Confer with clients to obtain and provide information when claims are made on a policy. | Insurance Sales Agents | Learning | 2.1% |
Occupations behind the signal
The occupations whose AI-touched tasks contribute most to this industry's signal, by employment here.
| Occupation | Workers | Share | How they use AI |
|---|---|---|---|
| Insurance Sales Agents | 353,250 | 35.7% | Learning |
| Customer Service Representatives | 125,640 | 12.7% | Directive |
| Insurance Claims and Policy Processing Clerks | 66,730 | 6.7% | Iteration |
| General and Operations Managers | 41,860 | 4.2% | Iteration |
| Claims Adjusters, Examiners, and Investigators | 40,880 | 4.1% | Learning |
| Office Clerks, General | 32,770 | 3.3% | Feedback loop |
| Insurance Underwriters | 31,670 | 3.2% | none |
| First-Line Supervisors of Office and Administrative Support Workers | 21,440 | 2.2% | Iteration |
| Secretaries and Administrative Assistants, Except Legal, Medical, and Executive | 19,920 | 2.0% | Directive |
| Market Research Analysts and Marketing Specialists | 16,220 | 1.6% | Directive |
| Financial Managers | 14,900 | 1.5% | Directive |
| Bookkeeping, Accounting, and Auditing Clerks | 13,730 | 1.4% | Directive |
This rollup is only as complete as the occupation-task matches available for the industry; the coverage figure above is shown so sparse industries do not look falsely precise. AI exposure is not the same as replacement.
Skill & tool metabolism
What this industry's work actually runs on. Each figure is the share of the industry's workers in occupations that significantly rely on a skill, knowledge area, or ability (O*NET importance ≥ 3 of 5), or that use a tool category — its employment reach. This is a measure of how widespread a requirement is across the workforce, not how intensively any one worker uses it. Shares are independent and need not add to 100%.
Based on 98.4% of this industry's employment that maps to a detailed occupation with an O*NET skill profile.
Skills
| Skill | Employment reach | Workers |
|---|---|---|
| Active Listening | 98.3% | 973,770 |
| Reading Comprehension | 98.2% | 972,630 |
| Speaking | 98.2% | 971,960 |
| Critical Thinking | 98.0% | 970,490 |
| Writing | 98.0% | 970,250 |
| Social Perceptiveness | 94.3% | 934,060 |
| Time Management | 93.7% | 927,910 |
| Service Orientation | 91.3% | 904,180 |
| Coordination | 81.8% | 809,900 |
| Judgment and Decision Making | 78.5% | 777,590 |
| Negotiation | 71.5% | 707,970 |
| Active Learning | 69.9% | 692,500 |
Knowledge areas
| Knowledge area | Employment reach | Workers |
|---|---|---|
| English Language | 98.2% | 972,680 |
| Customer and Personal Service | 97.1% | 961,970 |
| Administration and Management | 81.7% | 809,290 |
| Mathematics | 76.7% | 759,390 |
| Sales and Marketing | 58.3% | 576,870 |
| Law and Government | 48.5% | 480,370 |
| Computers and Electronics | 48.3% | 478,630 |
| Administrative | 47.8% | 473,280 |
| Education and Training | 44.5% | 440,580 |
| Communications and Media | 42.9% | 425,060 |
| Transportation | 35.7% | 353,830 |
| Economics and Accounting | 21.3% | 211,310 |
Abilities
| Abilitie | Employment reach | Workers |
|---|---|---|
| Oral Comprehension | 98.4% | 974,150 |
| Oral Expression | 98.4% | 974,150 |
| Near Vision | 98.3% | 973,270 |
| Speech Clarity | 98.2% | 972,170 |
| Speech Recognition | 98.2% | 972,500 |
| Written Comprehension | 98.2% | 972,630 |
| Written Expression | 98.1% | 971,290 |
| Information Ordering | 97.0% | 960,930 |
| Problem Sensitivity | 97.0% | 961,010 |
| Inductive Reasoning | 96.7% | 957,670 |
| Deductive Reasoning | 96.6% | 956,270 |
| Category Flexibility | 83.8% | 829,430 |
Tool categories
| Tool category | Employment reach | Workers |
|---|---|---|
| Electronic mail software | 99.5% | 984,810 |
| Office suite software | 99.5% | 984,900 |
| Spreadsheet software | 99.5% | 984,920 |
| Presentation software | 99.3% | 983,400 |
| Data base user interface and query software | 99.2% | 982,510 |
| Word processing software | 99.2% | 982,090 |
| Document management software | 97.3% | 963,870 |
| Internet browser software | 94.2% | 932,720 |
| Operating system software | 90.2% | 893,610 |
| Enterprise resource planning ERP software | 90.0% | 891,320 |
| Financial analysis software | 89.2% | 882,890 |
| Medical software | 83.9% | 831,000 |
| Customer relationship management CRM software | 82.0% | 811,780 |
| Web page creation and editing software | 74.8% | 740,400 |
| Instant messaging software | 73.0% | 723,080 |
Reach = share of industry employment in occupations where the requirement is significant; it is not a per-worker usage or proficiency measure. Skill, knowledge, and ability importance is from O*NET; tool use is reported presence of a technology category.
Largest occupations
The occupations that employ the most people in this industry, with their share of the industry's workforce and national median pay for the occupation (not industry-specific pay).
Showing the top 40 of 145 occupations by employment.
Most distinctive occupations
The occupations most unusually concentrated in this industry compared with the economy as a whole. The location quotient is how many times more common an occupation is here versus its economy-wide share (a value of 5 means five times as concentrated).
| Occupation | Concentration | Workers |
|---|---|---|
| Insurance Sales Agents | 117.16× | 353,250 |
| Insurance Underwriters | 45.74× | 31,670 |
| Insurance Claims and Policy Processing Clerks | 45.36× | 66,730 |
| Insurance Appraisers, Auto Damage | 29.98× | 1,500 |
| Claims Adjusters, Examiners, and Investigators | 20.87× | 40,880 |
| Actuaries | 19.72× | 3,590 |
| Compensation, Benefits, and Job Analysis Specialists | 9.84× | 6,470 |
| Financial Risk Specialists | 8.43× | 3,050 |
| Compensation and Benefits Managers | 7.99× | 1,030 |
| Customer Service Representatives | 7.18× | 125,640 |
| First-Line Supervisors of Non-Retail Sales Workers | 6.75× | 9,490 |
| Brokerage Clerks | 6.72× | 1,730 |
| Sales and Related Workers, All Other | 3.98× | 2,530 |
| Statistical Assistants | 3.43× | 130 |
| Sales Managers | 3.26× | 12,650 |
| Market Research Analysts and Marketing Specialists | 2.93× | 16,220 |
| Financial Managers | 2.83× | 14,900 |
| Title Examiners, Abstractors, and Searchers | 2.59× | 800 |
| File Clerks | 2.5× | 1,270 |
| Data Entry Keyers | 2.46× | 2,140 |
Write a report on thisheadline · factoids · citation
The Insurance Agencies and Brokerages workforce sits at the 99th percentile of AI task overlap — 990,240 U.S. workers
- Weighting every occupation by its real share of Insurance Agencies and Brokerages employment, the industry's workforce ranks in the 99th percentile (High band) for AI task overlap — overlap with what AI can attempt, not a measure of jobs at risk.Eloundou et al. + Felten AIOE, weighted by BLS OEWS
- The industry employs about 990,240 U.S. workers across 145 occupations.BLS OEWS (May 2024)
- Employment-weighted typical annual pay is about $70,355.BLS OEWS (May 2024)
- Of AI use observed across this industry's occupations, 49% looks like augmentation rather than automation — from a Claude.ai sample, not a census.Anthropic Economic Index
The Insurance Agencies and Brokerages workforce sits at the 99th percentile of AI task overlap — 990,240 U.S. workers

• Weighting every occupation by its real share of Insurance Agencies and Brokerages employment, the industry's workforce ranks in the 99th percentile (High band) for AI task overlap — overlap with what AI can attempt, not a measure of jobs at risk. (Eloundou et al. + Felten AIOE, weighted by BLS OEWS)
• The industry employs about 990,240 U.S. workers across 145 occupations. (BLS OEWS (May 2024))
• Employment-weighted typical annual pay is about $70,355. (BLS OEWS (May 2024))
• Of AI use observed across this industry's occupations, 49% looks like augmentation rather than automation — from a Claude.ai sample, not a census. (Anthropic Economic Index)

Source: Singulariki — "Insurance Agencies and Brokerages". https://singulariki.com/industries/524210
Note: AI task overlap measures what today's AI can attempt, not automation, job loss, or a forecast.
AssetsShare imageMethodology & sourcesPress & newsroomThe newsroom
Every line is built only from figures this page already shows and cites. AI task overlap means what today's AI can attempt — not automation, job loss, or a forecast.
Sources for this page
Every figure above traces to a named public dataset and the exact release below — not hand-written opinion. See the full methodology for what each measure does and does not mean.
- O*NET 30.3 U.S. Department of Labor / National Center for O*NET Development
- BLS Occupational Employment and Wage Statistics (OEWS) May 2024 U.S. Bureau of Labor Statistics
- Census NAICS 2022 U.S. Census Bureau
- Anthropic Economic Index v4 (2026-01-15) + v2 (2025-03-27) Anthropic
- “GPTs are GPTs” (Eloundou et al.) arXiv 2303.10130 OpenAI / academic
- AI Occupational Exposure (AIOE) Felten, Raj & Seamans academic
Data compiled June 3, 2026. Figures are estimates, not advice.
Cite this page
Singulariki. "Insurance Agencies and Brokerages." Singulariki: a source-backed encyclopedia of work. Built from O*NET 30.3; BLS Occupational Employment and Wage Statistics (OEWS) May 2024; Census NAICS 2022; Anthropic Economic Index v4 (2026-01-15) + v2 (2025-03-27); “GPTs are GPTs” (Eloundou et al.) arXiv 2303.10130; AI Occupational Exposure (AIOE) Felten, Raj & Seamans. Accessed June 7, 2026. https://singulariki.com/industries/524210
Singulariki. (2026). Insurance Agencies and Brokerages. Singulariki: a source-backed encyclopedia of work. Retrieved June 7, 2026, from https://singulariki.com/industries/524210
@misc{singulariki-524210,
  title  = {Insurance Agencies and Brokerages},
  author = {{Singulariki}},
  year   = {2026},
  note   = {O*NET 30.3; BLS Occupational Employment and Wage Statistics (OEWS) May 2024; Census NAICS 2022; Anthropic Economic Index v4 (2026-01-15) + v2 (2025-03-27); “GPTs are GPTs” (Eloundou et al.) arXiv 2303.10130; AI Occupational Exposure (AIOE) Felten, Raj & Seamans. Accessed June 7, 2026},
  url    = {https://singulariki.com/industries/524210}
} Citations name the underlying public dataset releases — they reflect what this page is built from, not just the URL.