Finance and Insurance
Sector · NAICS 52
A source-stamped Markdown brief of this occupation — paste it into an agent, or fetch
/industries/52/context.md directly.
Finance and Insurance is a U.S. industry in the NAICS classification. The Bureau of Labor Statistics estimates about 6,226,620 workers across 273 detailed occupations in it. A typical worker earns around $84,015 a year (Singulariki estimate, see below).
The Sector as a Whole The Finance and Insurance sector comprises establishments primarily engaged in financial transactions (transactions involving the creation, liquidation, or change in ownership of financial assets) and/or in facilitating financial transactions. Three principal types of activities are identified: 1. Raising funds by taking deposits and/or issuing securities and, in the process, incurring liabilities. Establishments engaged in this activity use raised funds to acquire financial assets by making loans and/or purchasing securities. Putting themselves at risk, they channel funds from lenders to borrowers and transform or repackage the funds with respect to maturity, scale, and risk. This activity is known as financial intermediation. 2. Pooling of risk by underwriting insurance and annuities. Establishments engaged in this activity collect fees, insurance premiums, or annuity considerations; build up reserves; invest those reserves; and make contractual payments. Fees are based on the expected incidence of the insured risk and the expected return on investment. 3. Providing specialized services facilitating or supporting financial intermediation, insurance, and employee benefit programs. In addition, monetary authorities charged with monetary control are included in this sector. The subsectors, industry groups, and industries within the Finance and Insurance sector are defined on the basis of their unique production processes. As with all industries, the production processes are distinguished by their use of specialized human resources and specialized physical capital. In addition, the way in which these establishments acquire and allocate financial capital, their source of funds, and the use of those funds provides a third basis for distinguishing characteristics of the production process. For instance, the production process in raising funds through deposit-taking is different from the process of raising funds in bond or money markets. The process of making loans to individuals also requires different production processes than does the creation of investment pools or the underwriting of securities. Most of the Finance and Insurance subsectors contain one or more industry groups of (1) intermediaries with similar patterns of raising and using funds and (2) establishments engaged in activities that facilitate, or are otherwise related to, that type of financial or insurance intermediation. Industries within this sector are defined in terms of activities for which a production process can be specified, and many of these activities are not exclusive to a particular type of financial institution. To deal with the varied activities taking place within existing financial institutions, the approach is to split these institutions into components performing specialized services. This requires defining the units engaged in providing those services and developing procedures that allow for their delineation. These units are the equivalents for finance and insurance of the establishments defined for other industries. The output of many financial services, as well as the inputs and the processes by which they are combined, cannot be observed at a single location and can only be defined at a higher level of the organizational structure of the enterprise. Additionally, a number of independent activities that represent separate and distinct production processes may take place at a single location belonging to a multilocation financial firm. Activities are more likely to be homogeneous with respect to production characteristics than are locations, at least in financial services. The classification defines activities broadly enough that it can be used both by those classifying by location and by those employing a more top-down approach to the delineation of the establishment. Establishments engaged in activities that facilitate, or are otherwise related to, the various types of intermediation are included in multiple subsectors, rather than in a separate subsector dedicated to services alone, because these services are performed by intermediaries, as well as by specialist establishments, and the extent to which the activity of the intermediaries can be separately identified is not clear. Financial industries are extensive users of electronic means for facilitating the verification of financial balances, authorizing transactions, transferring funds to and from transactors' accounts, notifying banks (or credit card issuers) of the individual transactions, and providing daily summaries. Since these transaction processing activities are integral to the production of finance and insurance services, establishments that principally provide a financial transaction processing service are classified in this sector, rather than in the data processing industry in the Information sector. Legal entities that hold portfolios of assets on behalf of others are significant and data on them are required for a variety of purposes. Thus, for NAICS, these funds, trusts, and other financial vehicles are the fifth subsector of the Finance and Insurance sector. These entities earn interest, dividends, and other property income, but have little or no employment and no revenue from the sale of services. Separate establishments and employees devoted to the management of funds are classified in Industry Group 5239, Other Financial Investment Activities.
Employment is national May 2024 OEWS. "Typical pay" is Singulariki's own figure — the employment-weighted average of each occupation's national median wage — a rough center of the industry, not an official BLS number.
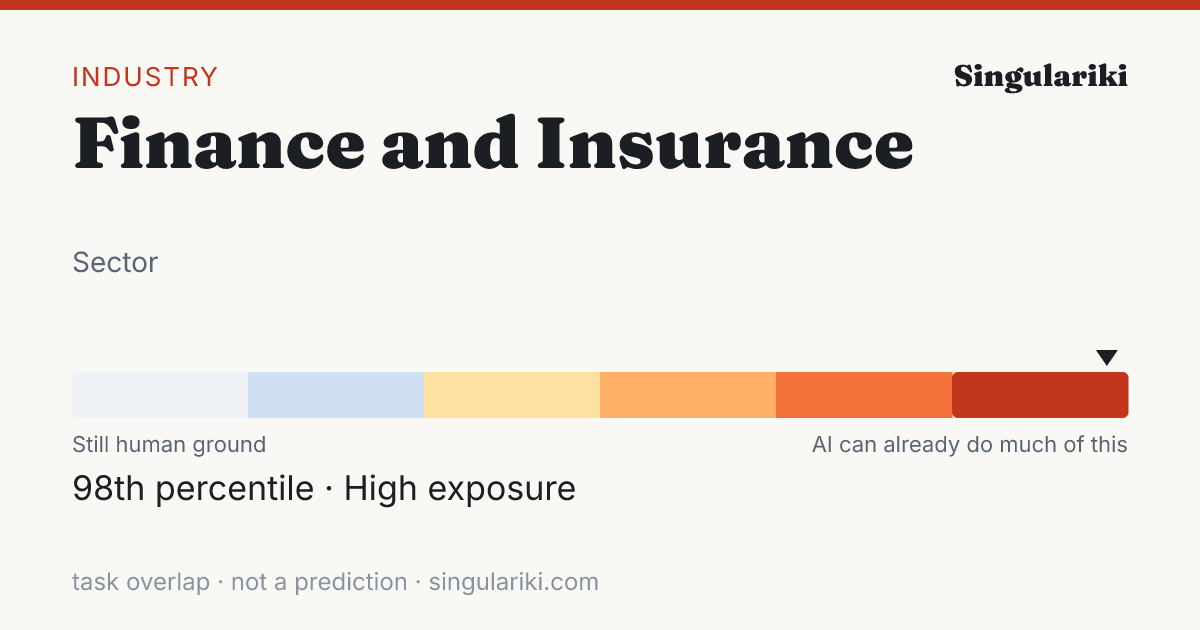
How exposed this industry is to AI
Weighting every occupation in this industry by its employment and its unified AI-exposure index (the OpenAI "GPTs are GPTs" human-rated task overlap folded with the Felten/Raj/Seamans AIOE index), this industry sits in the High band — 98th percentile across all industries.
Exposure measures how much of the work overlaps with what today's AI can do, not a prediction of automation; high-exposure industries are where AI is most likely to reshape tasks. Employment-weighted across 233 occupations that carry an exposure score. Compare every industry on the AI exposure hub.
How AI is actually used in this industry
Among measured Claude.ai (Free and Pro) conversations mapped to O*NET task statements (Anthropic Economic Index, 2026-01-15), these patterns are most associated with the occupations in this industry, weighted by its employment mix. They are shares of observed AI conversations — not of worker time, revenue, or what could be automated — and reflect one AI assistant's consumer sample, not all AI.
| Signal coverage | 88.6% of employment · 174/251 occupations have AEI task data |
| Augmentation vs. automation | 45.1% working with AI · 35.3% handed to AI |
| Most common pattern | Directive · AI does it; you give the instruction |
| Typical AI autonomy | 3.3 / 5 · higher = AI acts more independently |
Tasks driving the signal
The task families that account for the most AI activity across this industry's occupations (employment × observed usage), each attributed to the occupation it comes from.
| Task | Occupation | How | Share of signal |
|---|---|---|---|
| Troubleshoot problems involving office equipment, such as computer hardware and software. | Office Clerks, General | Feedback loop | 13.8% |
| Participate in the work of subordinates to facilitate productivity or to overcome difficult aspects of work. | First-Line Supervisors of Office and Administrative Support Workers | Iteration | 3.6% |
| Explain stock market terms or trading practices to clients. | Securities, Commodities, and Financial Services Sales Agents | Learning | 3.0% |
| Recommend financial products, such as stocks, bonds, mutual funds, or insurance. | Personal Financial Advisors | Directive | 2.9% |
| Offer advice on the purchase or sale of particular securities. | Securities, Commodities, and Financial Services Sales Agents | Learning | 2.8% |
| Analyze target companies or investment opportunities to inform investment decisions. | Securities, Commodities, and Financial Services Sales Agents | Directive | 2.5% |
| Analyze financial information obtained from clients to determine strategies for meeting clients' financial objectives. | Personal Financial Advisors | Iteration | 2.3% |
| Use computers for various applications, such as database management or word processing. | Secretaries and Administrative Assistants, Except Legal, Medical, and Executive | Directive | 2.3% |
| Develop or analyze information to assess the current or future financial status of firms. | Financial Managers | Directive | 2.3% |
| Conduct searches to find needed information, using such sources as the Internet. | Secretaries and Administrative Assistants, Except Legal, Medical, and Executive | Directive | 2.1% |
| Develop or maintain internal or external company Web sites. | Secretaries and Administrative Assistants, Except Legal, Medical, and Executive | Directive | 1.6% |
| Explain to customers the different types of loans and credit options that are available, as well as the terms of those services. | Loan Officers | Learning | 1.6% |
Occupations behind the signal
The occupations whose AI-touched tasks contribute most to this industry's signal, by employment here.
| Occupation | Workers | Share | How they use AI |
|---|---|---|---|
| Customer Service Representatives | 487,850 | 7.8% | Directive |
| Insurance Sales Agents | 451,930 | 7.3% | Learning |
| Securities, Commodities, and Financial Services Sales Agents | 447,410 | 7.2% | Directive |
| Tellers | 330,260 | 5.3% | Directive |
| Financial Managers | 255,610 | 4.1% | Directive |
| Personal Financial Advisors | 252,560 | 4.1% | Directive |
| Loan Officers | 244,580 | 3.9% | Learning |
| Claims Adjusters, Examiners, and Investigators | 224,390 | 3.6% | Learning |
| General and Operations Managers | 218,140 | 3.5% | Iteration |
| First-Line Supervisors of Office and Administrative Support Workers | 184,520 | 3.0% | Iteration |
| Insurance Claims and Policy Processing Clerks | 179,320 | 2.9% | Iteration |
| Financial and Investment Analysts | 150,630 | 2.4% | Directive |
This rollup is only as complete as the occupation-task matches available for the industry; the coverage figure above is shown so sparse industries do not look falsely precise. AI exposure is not the same as replacement.
Skill & tool metabolism
What this industry's work actually runs on. Each figure is the share of the industry's workers in occupations that significantly rely on a skill, knowledge area, or ability (O*NET importance ≥ 3 of 5), or that use a tool category — its employment reach. This is a measure of how widespread a requirement is across the workforce, not how intensively any one worker uses it. Shares are independent and need not add to 100%.
Based on 94.6% of this industry's employment that maps to a detailed occupation with an O*NET skill profile.
Skills
| Skill | Employment reach | Workers |
|---|---|---|
| Active Listening | 94.5% | 5,884,270 |
| Reading Comprehension | 94.4% | 5,877,390 |
| Speaking | 94.4% | 5,879,800 |
| Critical Thinking | 94.2% | 5,867,720 |
| Writing | 93.9% | 5,844,200 |
| Time Management | 91.2% | 5,681,120 |
| Social Perceptiveness | 87.6% | 5,454,860 |
| Service Orientation | 82.8% | 5,158,450 |
| Monitoring | 80.3% | 5,002,840 |
| Judgment and Decision Making | 75.5% | 4,699,880 |
| Complex Problem Solving | 72.8% | 4,534,440 |
| Active Learning | 70.9% | 4,412,040 |
Knowledge areas
| Knowledge area | Employment reach | Workers |
|---|---|---|
| English Language | 94.5% | 5,883,320 |
| Customer and Personal Service | 90.7% | 5,648,050 |
| Mathematics | 75.9% | 4,723,350 |
| Administration and Management | 67.4% | 4,194,460 |
| Computers and Electronics | 61.5% | 3,829,340 |
| Administrative | 50.5% | 3,141,840 |
| Economics and Accounting | 48.2% | 3,002,650 |
| Law and Government | 40.0% | 2,493,370 |
| Sales and Marketing | 35.3% | 2,197,730 |
| Education and Training | 22.2% | 1,382,110 |
| Personnel and Human Resources | 19.1% | 1,187,600 |
| Communications and Media | 16.5% | 1,024,680 |
Abilities
| Abilitie | Employment reach | Workers |
|---|---|---|
| Oral Comprehension | 94.6% | 5,890,820 |
| Oral Expression | 94.6% | 5,890,560 |
| Near Vision | 94.5% | 5,887,060 |
| Written Comprehension | 94.5% | 5,882,370 |
| Speech Recognition | 94.4% | 5,880,230 |
| Speech Clarity | 94.3% | 5,873,810 |
| Written Expression | 94.1% | 5,857,470 |
| Problem Sensitivity | 94.0% | 5,850,920 |
| Information Ordering | 93.5% | 5,820,900 |
| Deductive Reasoning | 93.0% | 5,788,340 |
| Inductive Reasoning | 92.9% | 5,786,440 |
| Category Flexibility | 84.0% | 5,229,100 |
Tool categories
| Tool category | Employment reach | Workers |
|---|---|---|
| Office suite software | 98.8% | 6,152,510 |
| Spreadsheet software | 98.8% | 6,152,970 |
| Electronic mail software | 98.7% | 6,145,800 |
| Presentation software | 98.4% | 6,127,770 |
| Word processing software | 98.3% | 6,121,300 |
| Data base user interface and query software | 98.1% | 6,107,750 |
| Document management software | 93.5% | 5,819,180 |
| Enterprise resource planning ERP software | 90.8% | 5,651,870 |
| Internet browser software | 82.8% | 5,153,010 |
| Financial analysis software | 80.8% | 5,031,320 |
| Customer relationship management CRM software | 77.9% | 4,848,840 |
| Operating system software | 77.6% | 4,834,740 |
| Accounting software | 74.1% | 4,610,880 |
| Project management software | 58.8% | 3,663,940 |
| Information retrieval or search software | 58.3% | 3,629,170 |
Reach = share of industry employment in occupations where the requirement is significant; it is not a per-worker usage or proficiency measure. Skill, knowledge, and ability importance is from O*NET; tool use is reported presence of a technology category.
Largest occupations
The occupations that employ the most people in this industry, with their share of the industry's workforce and national median pay for the occupation (not industry-specific pay).
Showing the top 40 of 273 occupations by employment.
Most distinctive occupations
The occupations most unusually concentrated in this industry compared with the economy as a whole. The location quotient is how many times more common an occupation is here versus its economy-wide share (a value of 5 means five times as concentrated).
For a sector this broad, the location quotient has a ceiling set by the sector's own share of national employment, so the top values tend to cluster near that limit.
| Occupation | Concentration | Workers |
|---|---|---|
| Tellers | 24.1× | 330,260 |
| New Accounts Clerks | 23.96× | 36,790 |
| Insurance Sales Agents | 23.84× | 451,930 |
| Securities, Commodities, and Financial Services Sales Agents | 23.46× | 447,410 |
| Insurance Underwriters | 23.27× | 101,320 |
| Insurance Appraisers, Auto Damage | 23.17× | 7,290 |
| Personal Financial Advisors | 23.12× | 252,560 |
| Brokerage Clerks | 21.8× | 35,300 |
| Loan Interviewers and Clerks | 20.9× | 146,110 |
| Loan Officers | 20.85× | 244,580 |
| Insurance Claims and Policy Processing Clerks | 19.38× | 179,320 |
| Actuaries | 18.26× | 20,900 |
| Claims Adjusters, Examiners, and Investigators | 18.22× | 224,390 |
| Credit Analysts | 17.87× | 48,610 |
| Financial Examiners | 15.87× | 40,260 |
| Financial Risk Specialists | 15.34× | 34,880 |
| Financial Clerks, All Other | 15.19× | 22,720 |
| Financial and Investment Analysts | 10.95× | 150,630 |
| Title Examiners, Abstractors, and Searchers | 8.74× | 17,000 |
| Credit Authorizers, Checkers, and Clerks | 8.12× | 3,920 |
Sub-industries
More detailed industries within Finance and Insurance.
Write a report on thisheadline · factoids · citation
The Finance and Insurance workforce sits at the 98th percentile of AI task overlap — 6,226,620 U.S. workers
- Weighting every occupation by its real share of Finance and Insurance employment, the industry's workforce ranks in the 98th percentile (High band) for AI task overlap — overlap with what AI can attempt, not a measure of jobs at risk.Eloundou et al. + Felten AIOE, weighted by BLS OEWS
- The industry employs about 6,226,620 U.S. workers across 273 occupations.BLS OEWS (May 2024)
- Employment-weighted typical annual pay is about $84,015.BLS OEWS (May 2024)
- Of AI use observed across this industry's occupations, 45% looks like augmentation rather than automation — from a Claude.ai sample, not a census.Anthropic Economic Index
The Finance and Insurance workforce sits at the 98th percentile of AI task overlap — 6,226,620 U.S. workers

• Weighting every occupation by its real share of Finance and Insurance employment, the industry's workforce ranks in the 98th percentile (High band) for AI task overlap — overlap with what AI can attempt, not a measure of jobs at risk. (Eloundou et al. + Felten AIOE, weighted by BLS OEWS)
• The industry employs about 6,226,620 U.S. workers across 273 occupations. (BLS OEWS (May 2024))
• Employment-weighted typical annual pay is about $84,015. (BLS OEWS (May 2024))
• Of AI use observed across this industry's occupations, 45% looks like augmentation rather than automation — from a Claude.ai sample, not a census. (Anthropic Economic Index)

Source: Singulariki — "Finance and Insurance". https://singulariki.com/industries/52
Note: AI task overlap measures what today's AI can attempt, not automation, job loss, or a forecast.
AssetsShare imageMethodology & sourcesPress & newsroomThe newsroom
Every line is built only from figures this page already shows and cites. AI task overlap means what today's AI can attempt — not automation, job loss, or a forecast.
Sources for this page
Every figure above traces to a named public dataset and the exact release below — not hand-written opinion. See the full methodology for what each measure does and does not mean.
- O*NET 30.3 U.S. Department of Labor / National Center for O*NET Development
- BLS Occupational Employment and Wage Statistics (OEWS) May 2024 U.S. Bureau of Labor Statistics
- Census NAICS 2022 U.S. Census Bureau
- Anthropic Economic Index v4 (2026-01-15) + v2 (2025-03-27) Anthropic
- “GPTs are GPTs” (Eloundou et al.) arXiv 2303.10130 OpenAI / academic
- AI Occupational Exposure (AIOE) Felten, Raj & Seamans academic
Data compiled June 3, 2026. Figures are estimates, not advice.
Cite this page
Singulariki. "Finance and Insurance." Singulariki: a source-backed encyclopedia of work. Built from O*NET 30.3; BLS Occupational Employment and Wage Statistics (OEWS) May 2024; Census NAICS 2022; Anthropic Economic Index v4 (2026-01-15) + v2 (2025-03-27); “GPTs are GPTs” (Eloundou et al.) arXiv 2303.10130; AI Occupational Exposure (AIOE) Felten, Raj & Seamans. Accessed June 7, 2026. https://singulariki.com/industries/52
Singulariki. (2026). Finance and Insurance. Singulariki: a source-backed encyclopedia of work. Retrieved June 7, 2026, from https://singulariki.com/industries/52
@misc{singulariki-52,
  title  = {Finance and Insurance},
  author = {{Singulariki}},
  year   = {2026},
  note   = {O*NET 30.3; BLS Occupational Employment and Wage Statistics (OEWS) May 2024; Census NAICS 2022; Anthropic Economic Index v4 (2026-01-15) + v2 (2025-03-27); “GPTs are GPTs” (Eloundou et al.) arXiv 2303.10130; AI Occupational Exposure (AIOE) Felten, Raj & Seamans. Accessed June 7, 2026},
  url    = {https://singulariki.com/industries/52}
} Citations name the underlying public dataset releases — they reflect what this page is built from, not just the URL.