Information
Sector · NAICS 51
A source-stamped Markdown brief of this occupation — paste it into an agent, or fetch
/industries/51/context.md directly.
Information is a U.S. industry in the NAICS classification. The Bureau of Labor Statistics estimates about 2,907,670 workers across 343 detailed occupations in it. A typical worker earns around $101,165 a year (Singulariki estimate, see below).
The Sector as a Whole The Information sector comprises establishments engaged in the following processes: (a) producing and distributing information and cultural products, (b) providing the means to transmit or distribute these products as well as data or communications, and (c) processing data. The main components of this sector are motion picture and sound recording industries; publishing industries, including software publishing; broadcasting and content providers; telecommunications industries; computing infrastructure providers, data processing, Web hosting, and related services; and Web search portals, libraries, archives, and other information services. The unique characteristics of information and cultural products, and of the processes involved in their production and distribution, distinguish the Information sector from the goods-producing and service-producing sectors. Some of these characteristics are: 1. Unlike traditional goods, an ''information or cultural product,'' such as an online newspaper or a television program, does not necessarily have tangible qualities, nor is it necessarily associated with a particular form. A movie can be viewed at a movie theater or through television broadcast, video-on-demand, or streaming services. A sound recording can be aired on radio, embedded in multimedia products, streamed, or sold at a record store. 2. Unlike traditional services, the delivery of these products does not require direct contact between the supplier and the consumer. 3. The value of these products to the consumer lies in their informational, educational, cultural, or entertainment content, not in the format in which they are distributed. Most of these products are protected from unlawful reproduction by copyright laws. 4. The intangible property aspect of information and cultural products makes the processes involved in their production and distribution very different from goods and services. Only those possessing the rights to these works are authorized to reproduce, alter, improve, and distribute them. Acquiring and using these rights often involves significant costs. In addition, technology has revolutionized the distribution of these products. It is possible to distribute them in a physical form, via broadcast, or online. 5. Distributors of information and cultural products can easily add value to the products they distribute. For instance, broadcasters add advertising not contained in the original product. This capacity means that unlike traditional goods distributors, they derive revenue not from sale of the distributed product to the final consumer, but from those who pay for the privilege of adding information to the original product. Similarly, a directory and mailing list publisher can acquire the rights to thousands of previously published newspaper and periodical articles and add new value by providing search and software and organizing the information in a way that facilitates research and retrieval. These products often command a much higher price than the original information. Excluded from this sector are establishments primarily engaged in custom design of software; mass reproducing software or other prerecorded audio and video material on magnetic or optical media; producing live artistic and cultural works or productions; and performing in or creating artistic and cultural works or productions as independent (i.e., freelance) individuals.
Employment is national May 2024 OEWS. "Typical pay" is Singulariki's own figure — the employment-weighted average of each occupation's national median wage — a rough center of the industry, not an official BLS number.
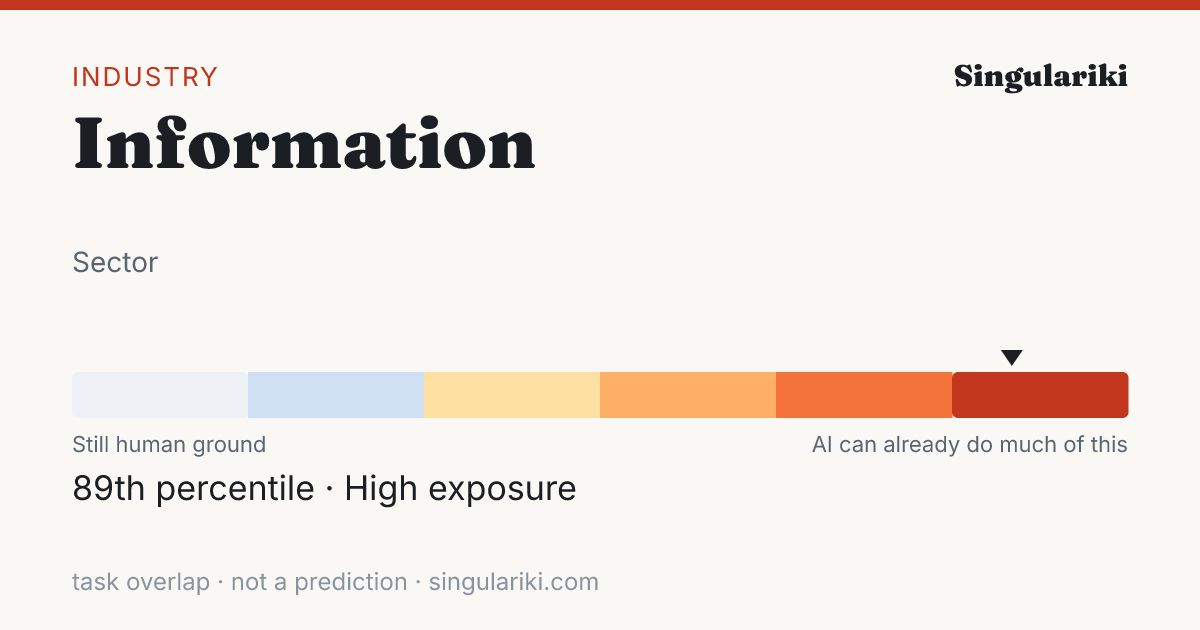
How exposed this industry is to AI
Weighting every occupation in this industry by its employment and its unified AI-exposure index (the OpenAI "GPTs are GPTs" human-rated task overlap folded with the Felten/Raj/Seamans AIOE index), this industry sits in the High band — 89th percentile across all industries.
Exposure measures how much of the work overlaps with what today's AI can do, not a prediction of automation; high-exposure industries are where AI is most likely to reshape tasks. Employment-weighted across 292 occupations that carry an exposure score. Compare every industry on the AI exposure hub.
How AI is actually used in this industry
Among measured Claude.ai (Free and Pro) conversations mapped to O*NET task statements (Anthropic Economic Index, 2026-01-15), these patterns are most associated with the occupations in this industry, weighted by its employment mix. They are shares of observed AI conversations — not of worker time, revenue, or what could be automated — and reflect one AI assistant's consumer sample, not all AI.
| Signal coverage | 56.7% of employment · 207/318 occupations have AEI task data |
| Augmentation vs. automation | 47.3% working with AI · 37.9% handed to AI |
| Most common pattern | Directive · AI does it; you give the instruction |
| Typical AI autonomy | 3.6 / 5 · higher = AI acts more independently |
Tasks driving the signal
The task families that account for the most AI activity across this industry's occupations (employment × observed usage), each attributed to the occupation it comes from.
| Task | Occupation | How | Share of signal |
|---|---|---|---|
| Prepare, rewrite and edit copy to improve readability, or supervise others who do this work. | Editors | Iteration | 19.1% |
| Troubleshoot problems involving office equipment, such as computer hardware and software. | Office Clerks, General | Feedback loop | 9.3% |
| Develop factors such as themes, plots, characterizations, psychological analyses, historical environments, action, and dialogue, to create material. | Writers and Authors | Directive | 3.4% |
| Read, evaluate and edit manuscripts or other materials submitted for publication and confer with authors regarding changes in content, style or organization, or publication. | Editors | Iteration | 1.8% |
| Answer customers' questions about products, prices, availability, or credit terms. | Sales Representatives, Wholesale and Manufacturing, Technical and Scientific Products | Directive | 1.7% |
| Edit, standardize, or make changes to material prepared by other writers or establishment personnel. | Technical Writers | Iteration | 1.7% |
| Write advertising copy for use by publication, broadcast, or internet media to promote the sale of goods and services. | Writers and Authors | Iteration | 1.7% |
| Write original or adapted material for dramas, comedies, puppet shows, narration, or other performances. | Actors | Directive | 1.7% |
| Collect and analyze data on customer demographics, preferences, needs, and buying habits to identify potential markets and factors affecting product demand. | Market Research Analysts and Marketing Specialists | Directive | 1.4% |
| Consult with writers, producers, or actors about script changes or "workshop" scripts, through rehearsal with writers and actors to create final drafts. | Producers and Directors | Iteration | 1.4% |
| Edit or rewrite existing copy as necessary, and submit copy for approval by supervisor. | Writers and Authors | Iteration | 1.4% |
| Present investment information, such as product risks, fees, or fund performance statistics. | Managers, All Other | Learning | 1.4% |
Occupations behind the signal
The occupations whose AI-touched tasks contribute most to this industry's signal, by employment here.
| Occupation | Workers | Share | How they use AI |
|---|---|---|---|
| Customer Service Representatives | 112,270 | 3.9% | Directive |
| Telecommunications Equipment Installers and Repairers, Except Line Installers | 105,420 | 3.6% | Feedback loop |
| General and Operations Managers | 102,990 | 3.5% | Iteration |
| Producers and Directors | 90,050 | 3.1% | Iteration |
| Computer and Information Systems Managers | 85,400 | 2.9% | Learning |
| Market Research Analysts and Marketing Specialists | 82,830 | 2.9% | Directive |
| Editors | 57,660 | 2.0% | Iteration |
| Sales Managers | 42,020 | 1.5% | Iteration |
| Advertising Sales Agents | 40,940 | 1.4% | Iteration |
| Marketing Managers | 39,700 | 1.4% | Iteration |
| Managers, All Other | 38,680 | 1.3% | Directive |
| Business Operations Specialists, All Other | 37,210 | 1.3% | Directive |
This rollup is only as complete as the occupation-task matches available for the industry; the coverage figure above is shown so sparse industries do not look falsely precise. AI exposure is not the same as replacement.
Skill & tool metabolism
What this industry's work actually runs on. Each figure is the share of the industry's workers in occupations that significantly rely on a skill, knowledge area, or ability (O*NET importance ≥ 3 of 5), or that use a tool category — its employment reach. This is a measure of how widespread a requirement is across the workforce, not how intensively any one worker uses it. Shares are independent and need not add to 100%.
Based on 89.6% of this industry's employment that maps to a detailed occupation with an O*NET skill profile.
Skills
| Skill | Employment reach | Workers |
|---|---|---|
| Active Listening | 89.2% | 2,592,190 |
| Speaking | 88.5% | 2,573,940 |
| Critical Thinking | 85.3% | 2,479,200 |
| Reading Comprehension | 83.6% | 2,430,420 |
| Monitoring | 82.8% | 2,408,080 |
| Time Management | 81.1% | 2,359,570 |
| Writing | 80.1% | 2,329,110 |
| Complex Problem Solving | 78.9% | 2,295,570 |
| Coordination | 77.1% | 2,240,890 |
| Judgment and Decision Making | 76.0% | 2,211,000 |
| Active Learning | 71.0% | 2,065,860 |
| Social Perceptiveness | 64.8% | 1,884,320 |
Knowledge areas
| Knowledge area | Employment reach | Workers |
|---|---|---|
| English Language | 88.8% | 2,580,670 |
| Customer and Personal Service | 81.7% | 2,376,870 |
| Computers and Electronics | 74.8% | 2,173,870 |
| Mathematics | 54.9% | 1,596,720 |
| Administration and Management | 54.3% | 1,578,660 |
| Administrative | 34.9% | 1,014,900 |
| Communications and Media | 32.5% | 944,080 |
| Education and Training | 29.1% | 846,720 |
| Engineering and Technology | 21.7% | 629,890 |
| Telecommunications | 20.3% | 591,300 |
| Sales and Marketing | 19.3% | 560,220 |
| Personnel and Human Resources | 15.5% | 451,050 |
Abilities
| Abilitie | Employment reach | Workers |
|---|---|---|
| Near Vision | 89.5% | 2,601,160 |
| Oral Comprehension | 89.5% | 2,603,330 |
| Oral Expression | 89.5% | 2,601,170 |
| Speech Clarity | 88.5% | 2,574,090 |
| Problem Sensitivity | 87.2% | 2,536,100 |
| Speech Recognition | 86.7% | 2,520,490 |
| Information Ordering | 86.2% | 2,505,150 |
| Written Comprehension | 85.4% | 2,483,100 |
| Deductive Reasoning | 84.3% | 2,450,820 |
| Inductive Reasoning | 83.7% | 2,433,810 |
| Written Expression | 77.7% | 2,258,260 |
| Category Flexibility | 76.8% | 2,234,370 |
Tool categories
| Tool category | Employment reach | Workers |
|---|---|---|
| Spreadsheet software | 98.0% | 2,850,670 |
| Office suite software | 97.9% | 2,846,420 |
| Word processing software | 96.1% | 2,794,970 |
| Electronic mail software | 95.4% | 2,774,530 |
| Presentation software | 92.9% | 2,701,750 |
| Operating system software | 86.1% | 2,503,060 |
| Data base user interface and query software | 80.6% | 2,342,700 |
| Enterprise resource planning ERP software | 79.2% | 2,302,800 |
| Project management software | 79.0% | 2,296,790 |
| Document management software | 72.7% | 2,115,260 |
| Analytical or scientific software | 72.1% | 2,095,660 |
| Desktop publishing software | 70.4% | 2,047,390 |
| Customer relationship management CRM software | 69.6% | 2,024,300 |
| Graphics or photo imaging software | 69.5% | 2,022,150 |
| Web page creation and editing software | 69.1% | 2,008,970 |
Reach = share of industry employment in occupations where the requirement is significant; it is not a per-worker usage or proficiency measure. Skill, knowledge, and ability importance is from O*NET; tool use is reported presence of a technology category.
Largest occupations
The occupations that employ the most people in this industry, with their share of the industry's workforce and national median pay for the occupation (not industry-specific pay).
Showing the top 40 of 343 occupations by employment.
Most distinctive occupations
The occupations most unusually concentrated in this industry compared with the economy as a whole. The location quotient is how many times more common an occupation is here versus its economy-wide share (a value of 5 means five times as concentrated).
For a sector this broad, the location quotient has a ceiling set by the sector's own share of national employment, so the top values tend to cluster near that limit.
Sub-industries
More detailed industries within Information.
Write a report on thisheadline · factoids · citation
The Information workforce sits at the 89th percentile of AI task overlap — 2,907,670 U.S. workers
- Weighting every occupation by its real share of Information employment, the industry's workforce ranks in the 89th percentile (High band) for AI task overlap — overlap with what AI can attempt, not a measure of jobs at risk.Eloundou et al. + Felten AIOE, weighted by BLS OEWS
- The industry employs about 2,907,670 U.S. workers across 343 occupations.BLS OEWS (May 2024)
- Employment-weighted typical annual pay is about $101,165.BLS OEWS (May 2024)
- Of AI use observed across this industry's occupations, 47% looks like augmentation rather than automation — from a Claude.ai sample, not a census.Anthropic Economic Index
The Information workforce sits at the 89th percentile of AI task overlap — 2,907,670 U.S. workers

• Weighting every occupation by its real share of Information employment, the industry's workforce ranks in the 89th percentile (High band) for AI task overlap — overlap with what AI can attempt, not a measure of jobs at risk. (Eloundou et al. + Felten AIOE, weighted by BLS OEWS)
• The industry employs about 2,907,670 U.S. workers across 343 occupations. (BLS OEWS (May 2024))
• Employment-weighted typical annual pay is about $101,165. (BLS OEWS (May 2024))
• Of AI use observed across this industry's occupations, 47% looks like augmentation rather than automation — from a Claude.ai sample, not a census. (Anthropic Economic Index)

Source: Singulariki — "Information". https://singulariki.com/industries/51
Note: AI task overlap measures what today's AI can attempt, not automation, job loss, or a forecast.
AssetsShare imageMethodology & sourcesPress & newsroomThe newsroom
Every line is built only from figures this page already shows and cites. AI task overlap means what today's AI can attempt — not automation, job loss, or a forecast.
Sources for this page
Every figure above traces to a named public dataset and the exact release below — not hand-written opinion. See the full methodology for what each measure does and does not mean.
- O*NET 30.3 U.S. Department of Labor / National Center for O*NET Development
- BLS Occupational Employment and Wage Statistics (OEWS) May 2024 U.S. Bureau of Labor Statistics
- Census NAICS 2022 U.S. Census Bureau
- Anthropic Economic Index v4 (2026-01-15) + v2 (2025-03-27) Anthropic
- “GPTs are GPTs” (Eloundou et al.) arXiv 2303.10130 OpenAI / academic
- AI Occupational Exposure (AIOE) Felten, Raj & Seamans academic
Data compiled June 3, 2026. Figures are estimates, not advice.
Cite this page
Singulariki. "Information." Singulariki: a source-backed encyclopedia of work. Built from O*NET 30.3; BLS Occupational Employment and Wage Statistics (OEWS) May 2024; Census NAICS 2022; Anthropic Economic Index v4 (2026-01-15) + v2 (2025-03-27); “GPTs are GPTs” (Eloundou et al.) arXiv 2303.10130; AI Occupational Exposure (AIOE) Felten, Raj & Seamans. Accessed June 7, 2026. https://singulariki.com/industries/51
Singulariki. (2026). Information. Singulariki: a source-backed encyclopedia of work. Retrieved June 7, 2026, from https://singulariki.com/industries/51
@misc{singulariki-51,
  title  = {Information},
  author = {{Singulariki}},
  year   = {2026},
  note   = {O*NET 30.3; BLS Occupational Employment and Wage Statistics (OEWS) May 2024; Census NAICS 2022; Anthropic Economic Index v4 (2026-01-15) + v2 (2025-03-27); “GPTs are GPTs” (Eloundou et al.) arXiv 2303.10130; AI Occupational Exposure (AIOE) Felten, Raj & Seamans. Accessed June 7, 2026},
  url    = {https://singulariki.com/industries/51}
} Citations name the underlying public dataset releases — they reflect what this page is built from, not just the URL.