Fitness and Recreational Sports Centers
National industry · NAICS 713940
A source-stamped Markdown brief of this occupation — paste it into an agent, or fetch
/industries/713940/context.md directly.
Fitness and Recreational Sports Centers is a U.S. industry in the NAICS classification. The Bureau of Labor Statistics estimates about 630,400 workers across 157 detailed occupations in it. A typical worker earns around $40,163 a year (Singulariki estimate, see below).
This industry comprises establishments primarily engaged in operating fitness and recreational sports facilities featuring exercise and other active physical fitness conditioning or recreational sports activities, such as swimming, skating, or racquet sports. Illustrative Examples: Aerobic dance or exercise centers Ice or roller skating rinks Gymnasiums Physical fitness centers Handball, racquetball, or tennis club facilities Swimming or wave pools Cross-References.
Employment is national May 2024 OEWS. "Typical pay" is Singulariki's own figure — the employment-weighted average of each occupation's national median wage — a rough center of the industry, not an official BLS number.
How exposed this industry is to AI
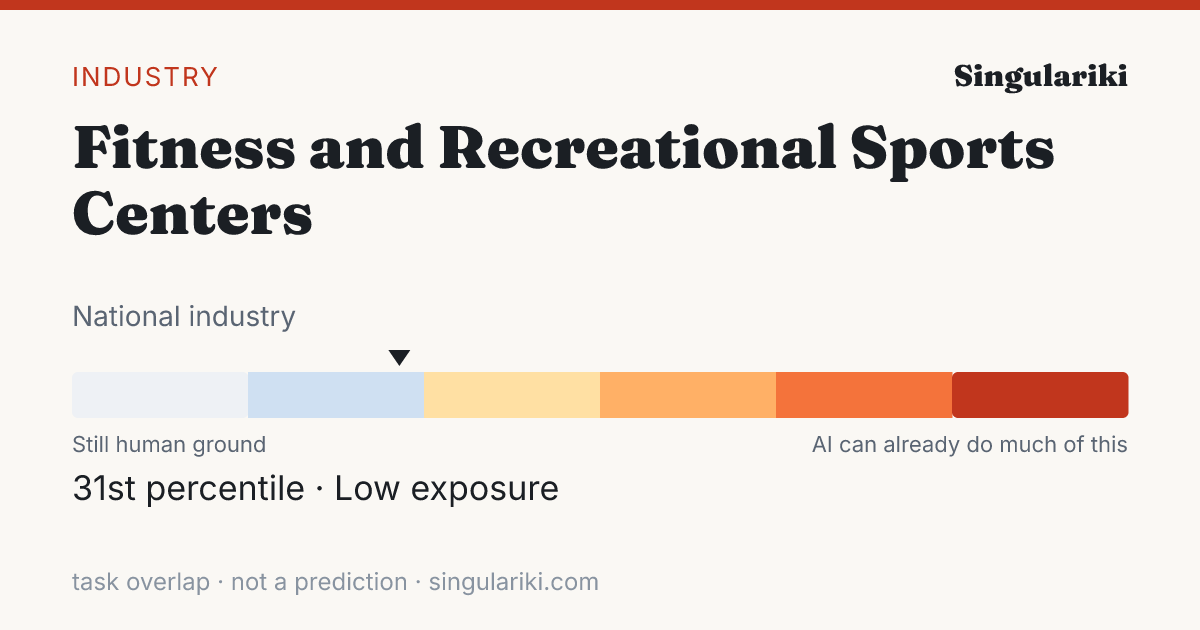
Weighting every occupation in this industry by its employment and its unified AI-exposure index (the OpenAI "GPTs are GPTs" human-rated task overlap folded with the Felten/Raj/Seamans AIOE index), this industry sits in the Low band — 31st percentile across all industries.
Exposure measures how much of the work overlaps with what today's AI can do, not a prediction of automation; high-exposure industries are where AI is most likely to reshape tasks. Employment-weighted across 120 occupations that carry an exposure score. Compare every industry on the AI exposure hub.
How AI is actually used in this industry
Among measured Claude.ai (Free and Pro) conversations mapped to O*NET task statements (Anthropic Economic Index, 2026-01-15), these patterns are most associated with the occupations in this industry, weighted by its employment mix. They are shares of observed AI conversations — not of worker time, revenue, or what could be automated — and reflect one AI assistant's consumer sample, not all AI.
| Signal coverage | 81.8% of employment · 87/131 occupations have AEI task data |
| Augmentation vs. automation | 58.4% working with AI · 24.4% handed to AI |
| Most common pattern | Learning · you ask AI to explain or teach |
| Typical AI autonomy | 3.6 / 5 · higher = AI acts more independently |
Tasks driving the signal
The task families that account for the most AI activity across this industry's occupations (employment × observed usage), each attributed to the occupation it comes from.
| Task | Occupation | How | Share of signal |
|---|---|---|---|
| Troubleshoot problems involving office equipment, such as computer hardware and software. | Office Clerks, General | Feedback loop | 20.0% |
| Conduct classes, workshops, and demonstrations, and provide individual instruction to teach topics and skills such as cooking, dancing, writing, physical fitness, photography, personal finance, and flying. | Self-Enrichment Teachers | Learning | 8.5% |
| Process and prepare memos, correspondence, travel vouchers, or other documents. | Receptionists and Information Clerks | Iteration | 4.7% |
| Answer customers' questions, and provide information on procedures or policies. | Cashiers | Directive | 3.8% |
| Help children with homework and school work. | Childcare Workers | Iteration | 3.8% |
| Instruct participants in maintaining exertion levels to maximize benefits from exercise routines. | Exercise Trainers and Group Fitness Instructors | Learning | 2.9% |
| Review instructional content, methods, and student evaluations to assess strengths and weaknesses, and to develop recommendations for course revision, development, or elimination. | Self-Enrichment Teachers | Iteration | 2.8% |
| Participate in the work of subordinates to facilitate productivity or to overcome difficult aspects of work. | First-Line Supervisors of Office and Administrative Support Workers | Iteration | 2.3% |
| Use computers, audio-visual aids, and other equipment and materials to supplement presentations. | Self-Enrichment Teachers | Learning | 2.0% |
| Use computers for various applications, such as database management or word processing. | Secretaries and Administrative Assistants, Except Legal, Medical, and Executive | Directive | 1.9% |
| Keep records of customer interactions or transactions, recording details of inquiries, complaints, or comments, as well as actions taken. | Customer Service Representatives | Directive | 1.9% |
| Conduct searches to find needed information, using such sources as the Internet. | Secretaries and Administrative Assistants, Except Legal, Medical, and Executive | Directive | 1.8% |
Occupations behind the signal
The occupations whose AI-touched tasks contribute most to this industry's signal, by employment here.
| Occupation | Workers | Share | How they use AI |
|---|---|---|---|
| Exercise Trainers and Group Fitness Instructors | 199,210 | 31.6% | Learning |
| Receptionists and Information Clerks | 51,450 | 8.2% | Directive |
| Amusement and Recreation Attendants | 51,150 | 8.1% | Directive |
| Childcare Workers | 27,830 | 4.4% | Directive |
| Customer Service Representatives | 27,800 | 4.4% | Directive |
| Coaches and Scouts | 23,930 | 3.8% | Learning |
| General and Operations Managers | 20,850 | 3.3% | Iteration |
| Self-Enrichment Teachers | 15,260 | 2.4% | Learning |
| Recreation Workers | 14,140 | 2.2% | Iteration |
| Maintenance and Repair Workers, General | 10,530 | 1.7% | Learning |
| Office Clerks, General | 7,500 | 1.2% | Feedback loop |
| First-Line Supervisors of Office and Administrative Support Workers | 5,300 | 0.8% | Iteration |
This rollup is only as complete as the occupation-task matches available for the industry; the coverage figure above is shown so sparse industries do not look falsely precise. AI exposure is not the same as replacement.
Skill & tool metabolism
What this industry's work actually runs on. Each figure is the share of the industry's workers in occupations that significantly rely on a skill, knowledge area, or ability (O*NET importance ≥ 3 of 5), or that use a tool category — its employment reach. This is a measure of how widespread a requirement is across the workforce, not how intensively any one worker uses it. Shares are independent and need not add to 100%.
Based on 94.2% of this industry's employment that maps to a detailed occupation with an O*NET skill profile.
Skills
| Skill | Employment reach | Workers |
|---|---|---|
| Active Listening | 92.8% | 585,150 |
| Speaking | 92.7% | 584,100 |
| Service Orientation | 86.4% | 544,730 |
| Social Perceptiveness | 86.4% | 544,590 |
| Critical Thinking | 78.8% | 496,960 |
| Coordination | 75.1% | 473,150 |
| Reading Comprehension | 73.8% | 465,400 |
| Monitoring | 70.0% | 441,490 |
| Judgment and Decision Making | 62.7% | 395,290 |
| Time Management | 62.7% | 395,180 |
| Learning Strategies | 58.1% | 366,270 |
| Active Learning | 58.0% | 365,440 |
Knowledge areas
| Knowledge area | Employment reach | Workers |
|---|---|---|
| English Language | 90.8% | 572,260 |
| Customer and Personal Service | 88.4% | 557,170 |
| Education and Training | 54.6% | 344,460 |
| Psychology | 46.0% | 290,010 |
| Public Safety and Security | 31.2% | 196,820 |
| Administrative | 31.1% | 196,100 |
| Computers and Electronics | 25.1% | 158,440 |
| Administration and Management | 24.6% | 154,840 |
| Mathematics | 16.7% | 105,170 |
| Personnel and Human Resources | 11.9% | 75,000 |
| Sales and Marketing | 9.8% | 61,920 |
| Communications and Media | 6.4% | 40,060 |
Abilities
| Abilitie | Employment reach | Workers |
|---|---|---|
| Near Vision | 94.0% | 592,430 |
| Oral Comprehension | 93.3% | 588,130 |
| Oral Expression | 93.1% | 586,710 |
| Speech Recognition | 89.7% | 565,300 |
| Speech Clarity | 89.6% | 564,550 |
| Problem Sensitivity | 84.0% | 529,250 |
| Written Comprehension | 74.3% | 468,600 |
| Information Ordering | 71.4% | 450,120 |
| Deductive Reasoning | 70.0% | 441,000 |
| Inductive Reasoning | 69.4% | 437,490 |
| Selective Attention | 65.9% | 415,310 |
| Category Flexibility | 54.2% | 341,720 |
Tool categories
| Tool category | Employment reach | Workers |
|---|---|---|
| Spreadsheet software | 98.4% | 620,060 |
| Word processing software | 97.2% | 612,900 |
| Office suite software | 92.8% | 584,850 |
| Electronic mail software | 91.4% | 576,460 |
| Internet browser software | 81.2% | 512,050 |
| Data base user interface and query software | 77.7% | 490,060 |
| Presentation software | 77.7% | 489,940 |
| Desktop publishing software | 73.2% | 461,670 |
| Project management software | 62.1% | 391,180 |
| Calendar and scheduling software | 59.5% | 375,040 |
| Instant messaging software | 58.0% | 365,690 |
| Accounting software | 55.1% | 347,190 |
| Medical software | 52.7% | 332,480 |
| Enterprise resource planning ERP software | 52.1% | 328,250 |
| Operating system software | 41.2% | 259,680 |
Reach = share of industry employment in occupations where the requirement is significant; it is not a per-worker usage or proficiency measure. Skill, knowledge, and ability importance is from O*NET; tool use is reported presence of a technology category.
Largest occupations
The occupations that employ the most people in this industry, with their share of the industry's workforce and national median pay for the occupation (not industry-specific pay).
Showing the top 40 of 157 occupations by employment.
Most distinctive occupations
The occupations most unusually concentrated in this industry compared with the economy as a whole. The location quotient is how many times more common an occupation is here versus its economy-wide share (a value of 5 means five times as concentrated).
Write a report on thisheadline · factoids · citation
The Fitness and Recreational Sports Centers workforce sits at the 31st percentile of AI task overlap — 630,400 U.S. workers
- Weighting every occupation by its real share of Fitness and Recreational Sports Centers employment, the industry's workforce ranks in the 31st percentile (Low band) for AI task overlap — overlap with what AI can attempt, not a measure of jobs at risk.Eloundou et al. + Felten AIOE, weighted by BLS OEWS
- The industry employs about 630,400 U.S. workers across 157 occupations.BLS OEWS (May 2024)
- Employment-weighted typical annual pay is about $40,163.BLS OEWS (May 2024)
- Of AI use observed across this industry's occupations, 58% looks like augmentation rather than automation — from a Claude.ai sample, not a census.Anthropic Economic Index
The Fitness and Recreational Sports Centers workforce sits at the 31st percentile of AI task overlap — 630,400 U.S. workers

• Weighting every occupation by its real share of Fitness and Recreational Sports Centers employment, the industry's workforce ranks in the 31st percentile (Low band) for AI task overlap — overlap with what AI can attempt, not a measure of jobs at risk. (Eloundou et al. + Felten AIOE, weighted by BLS OEWS)
• The industry employs about 630,400 U.S. workers across 157 occupations. (BLS OEWS (May 2024))
• Employment-weighted typical annual pay is about $40,163. (BLS OEWS (May 2024))
• Of AI use observed across this industry's occupations, 58% looks like augmentation rather than automation — from a Claude.ai sample, not a census. (Anthropic Economic Index)

Source: Singulariki — "Fitness and Recreational Sports Centers". https://singulariki.com/industries/713940
Note: AI task overlap measures what today's AI can attempt, not automation, job loss, or a forecast.
AssetsShare imageMethodology & sourcesPress & newsroomThe newsroom
Every line is built only from figures this page already shows and cites. AI task overlap means what today's AI can attempt — not automation, job loss, or a forecast.
Sources for this page
Every figure above traces to a named public dataset and the exact release below — not hand-written opinion. See the full methodology for what each measure does and does not mean.
- O*NET 30.3 U.S. Department of Labor / National Center for O*NET Development
- BLS Occupational Employment and Wage Statistics (OEWS) May 2024 U.S. Bureau of Labor Statistics
- Census NAICS 2022 U.S. Census Bureau
- Anthropic Economic Index v4 (2026-01-15) + v2 (2025-03-27) Anthropic
- “GPTs are GPTs” (Eloundou et al.) arXiv 2303.10130 OpenAI / academic
- AI Occupational Exposure (AIOE) Felten, Raj & Seamans academic
Data compiled June 3, 2026. Figures are estimates, not advice.
Cite this page
Singulariki. "Fitness and Recreational Sports Centers." Singulariki: a source-backed encyclopedia of work. Built from O*NET 30.3; BLS Occupational Employment and Wage Statistics (OEWS) May 2024; Census NAICS 2022; Anthropic Economic Index v4 (2026-01-15) + v2 (2025-03-27); “GPTs are GPTs” (Eloundou et al.) arXiv 2303.10130; AI Occupational Exposure (AIOE) Felten, Raj & Seamans. Accessed June 7, 2026. https://singulariki.com/industries/713940
Singulariki. (2026). Fitness and Recreational Sports Centers. Singulariki: a source-backed encyclopedia of work. Retrieved June 7, 2026, from https://singulariki.com/industries/713940
@misc{singulariki-713940,
  title  = {Fitness and Recreational Sports Centers},
  author = {{Singulariki}},
  year   = {2026},
  note   = {O*NET 30.3; BLS Occupational Employment and Wage Statistics (OEWS) May 2024; Census NAICS 2022; Anthropic Economic Index v4 (2026-01-15) + v2 (2025-03-27); “GPTs are GPTs” (Eloundou et al.) arXiv 2303.10130; AI Occupational Exposure (AIOE) Felten, Raj & Seamans. Accessed June 7, 2026},
  url    = {https://singulariki.com/industries/713940}
} Citations name the underlying public dataset releases — they reflect what this page is built from, not just the URL.