Arts, Entertainment, and Recreation
Sector · NAICS 71
A source-stamped Markdown brief of this occupation — paste it into an agent, or fetch
/industries/71/context.md directly.
Arts, Entertainment, and Recreation is a U.S. industry in the NAICS classification. The Bureau of Labor Statistics estimates about 2,642,240 workers across 378 detailed occupations in it. A typical worker earns around $43,730 a year (Singulariki estimate, see below).
The Sector as a Whole The Arts, Entertainment, and Recreation sector includes a wide range of establishments that operate facilities or provide services to meet varied cultural, entertainment, and recreational interests of their patrons. This sector comprises (1) establishments that are involved in producing, promoting, or participating in live performances, events, or exhibits intended for public viewing; (2) establishments that preserve and exhibit objects and sites of historical, cultural, or educational interest; and (3) establishments that operate facilities or provide services that enable patrons to participate in recreational activities or pursue amusement, hobby, and leisure-time interests. Some establishments that provide cultural, entertainment, or recreational facilities and services are classified in other sectors. Excluded from this sector are: (1) establishments that provide both accommodations and recreational facilities, such as hunting and fishing camps and resort and casino hotels, are classified in Subsector 721, Accommodation; (2) restaurants and night clubs that provide live entertainment in addition to the sale of food and beverages are classified in Subsector 722, Food Services and Drinking Places; (3) motion picture theaters, libraries and archives, and publishers of newspapers, magazines, books, periodicals, and computer software are classified in Sector 51, Information; and (4) establishments using transportation equipment to provide recreational and entertainment services, such as those operating sightseeing buses, dinner cruises, or helicopter rides, are classified in Subsector 487, Scenic and Sightseeing Transportation.
Employment is national May 2024 OEWS. "Typical pay" is Singulariki's own figure — the employment-weighted average of each occupation's national median wage — a rough center of the industry, not an official BLS number.
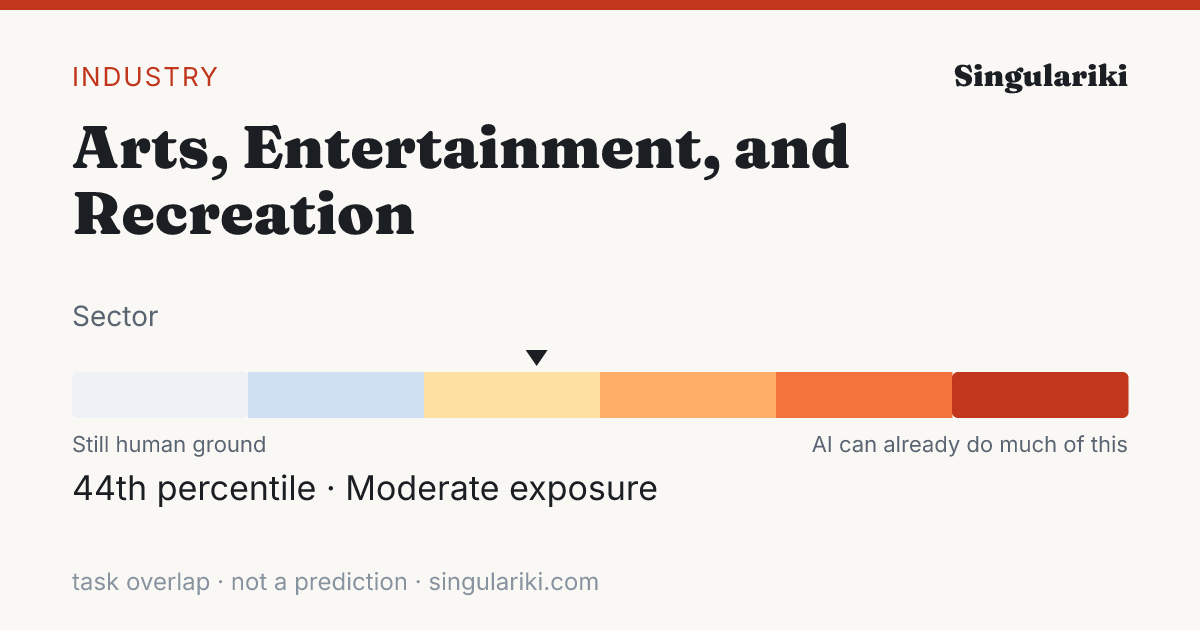
How exposed this industry is to AI
Weighting every occupation in this industry by its employment and its unified AI-exposure index (the OpenAI "GPTs are GPTs" human-rated task overlap folded with the Felten/Raj/Seamans AIOE index), this industry sits in the Moderate band — 44th percentile across all industries.
Exposure measures how much of the work overlaps with what today's AI can do, not a prediction of automation; high-exposure industries are where AI is most likely to reshape tasks. Employment-weighted across 330 occupations that carry an exposure score. Compare every industry on the AI exposure hub.
How AI is actually used in this industry
Among measured Claude.ai (Free and Pro) conversations mapped to O*NET task statements (Anthropic Economic Index, 2026-01-15), these patterns are most associated with the occupations in this industry, weighted by its employment mix. They are shares of observed AI conversations — not of worker time, revenue, or what could be automated — and reflect one AI assistant's consumer sample, not all AI.
| Signal coverage | 75.0% of employment · 212/360 occupations have AEI task data |
| Augmentation vs. automation | 48.3% working with AI · 32.6% handed to AI |
| Most common pattern | Directive · AI does it; you give the instruction |
| Typical AI autonomy | 3.5 / 5 · higher = AI acts more independently |
Tasks driving the signal
The task families that account for the most AI activity across this industry's occupations (employment × observed usage), each attributed to the occupation it comes from.
| Task | Occupation | How | Share of signal |
|---|---|---|---|
| Troubleshoot problems involving office equipment, such as computer hardware and software. | Office Clerks, General | Feedback loop | 14.8% |
| Answer customers' questions, and provide information on procedures or policies. | Cashiers | Directive | 10.3% |
| Write original or adapted material for dramas, comedies, puppet shows, narration, or other performances. | Actors | Directive | 4.8% |
| Conduct classes, workshops, and demonstrations, and provide individual instruction to teach topics and skills such as cooking, dancing, writing, physical fitness, photography, personal finance, and flying. | Self-Enrichment Teachers | Learning | 4.1% |
| Develop factors such as themes, plots, characterizations, psychological analyses, historical environments, action, and dialogue, to create material. | Writers and Authors | Directive | 2.4% |
| Use computers for various applications, such as database management or word processing. | Secretaries and Administrative Assistants, Except Legal, Medical, and Executive | Directive | 2.3% |
| Recommend, select, and help locate or obtain merchandise based on customer needs and desires. | Retail Salespersons | Iteration | 2.2% |
| Conduct searches to find needed information, using such sources as the Internet. | Secretaries and Administrative Assistants, Except Legal, Medical, and Executive | Directive | 2.1% |
| Greet customers and ascertain what each customer wants or needs. | Retail Salespersons | none | 2.1% |
| Develop or maintain internal or external company Web sites. | Secretaries and Administrative Assistants, Except Legal, Medical, and Executive | Directive | 1.6% |
| Provide information about facilities, entertainment options, and rules and regulations. | Amusement and Recreation Attendants | Directive | 1.4% |
| Assist customers by providing information and resolving their complaints. | Cashiers | Iteration | 1.4% |
Occupations behind the signal
The occupations whose AI-touched tasks contribute most to this industry's signal, by employment here.
| Occupation | Workers | Share | How they use AI |
|---|---|---|---|
| Amusement and Recreation Attendants | 276,690 | 10.5% | Directive |
| Exercise Trainers and Group Fitness Instructors | 206,110 | 7.8% | Learning |
| Landscaping and Groundskeeping Workers | 101,840 | 3.9% | Learning |
| Waiters and Waitresses | 96,680 | 3.7% | Directive |
| General and Operations Managers | 87,950 | 3.3% | Iteration |
| Coaches and Scouts | 63,720 | 2.4% | Learning |
| Receptionists and Information Clerks | 61,270 | 2.3% | Directive |
| Customer Service Representatives | 60,990 | 2.3% | Directive |
| Bartenders | 55,000 | 2.1% | Directive |
| Maintenance and Repair Workers, General | 53,460 | 2.0% | Learning |
| Retail Salespersons | 52,100 | 2.0% | none |
| Cashiers | 51,320 | 1.9% | Directive |
This rollup is only as complete as the occupation-task matches available for the industry; the coverage figure above is shown so sparse industries do not look falsely precise. AI exposure is not the same as replacement.
Skill & tool metabolism
What this industry's work actually runs on. Each figure is the share of the industry's workers in occupations that significantly rely on a skill, knowledge area, or ability (O*NET importance ≥ 3 of 5), or that use a tool category — its employment reach. This is a measure of how widespread a requirement is across the workforce, not how intensively any one worker uses it. Shares are independent and need not add to 100%.
Based on 93.8% of this industry's employment that maps to a detailed occupation with an O*NET skill profile.
Skills
| Skill | Employment reach | Workers |
|---|---|---|
| Active Listening | 86.5% | 2,285,680 |
| Speaking | 84.6% | 2,235,010 |
| Social Perceptiveness | 74.8% | 1,977,090 |
| Service Orientation | 70.5% | 1,862,910 |
| Coordination | 62.0% | 1,637,500 |
| Monitoring | 60.9% | 1,610,310 |
| Critical Thinking | 59.9% | 1,583,570 |
| Reading Comprehension | 57.9% | 1,529,170 |
| Time Management | 50.0% | 1,321,780 |
| Judgment and Decision Making | 44.6% | 1,178,770 |
| Active Learning | 42.0% | 1,110,130 |
| Writing | 37.3% | 985,180 |
Knowledge areas
| Knowledge area | Employment reach | Workers |
|---|---|---|
| English Language | 90.0% | 2,376,750 |
| Customer and Personal Service | 84.3% | 2,228,110 |
| Administration and Management | 35.9% | 948,850 |
| Administrative | 31.8% | 840,580 |
| Education and Training | 31.8% | 839,600 |
| Public Safety and Security | 31.6% | 835,850 |
| Computers and Electronics | 25.7% | 678,110 |
| Mathematics | 24.1% | 637,740 |
| Sales and Marketing | 20.5% | 541,050 |
| Psychology | 19.6% | 519,030 |
| Personnel and Human Resources | 14.5% | 384,200 |
| Communications and Media | 13.2% | 349,220 |
Abilities
| Abilitie | Employment reach | Workers |
|---|---|---|
| Near Vision | 93.5% | 2,471,590 |
| Oral Comprehension | 89.2% | 2,357,670 |
| Oral Expression | 88.6% | 2,340,030 |
| Problem Sensitivity | 84.4% | 2,229,590 |
| Speech Recognition | 84.2% | 2,224,800 |
| Speech Clarity | 83.7% | 2,211,030 |
| Information Ordering | 68.1% | 1,798,540 |
| Deductive Reasoning | 59.3% | 1,568,010 |
| Written Comprehension | 59.1% | 1,560,570 |
| Inductive Reasoning | 53.9% | 1,423,260 |
| Selective Attention | 48.1% | 1,269,680 |
| Written Expression | 43.3% | 1,143,950 |
Tool categories
| Tool category | Employment reach | Workers |
|---|---|---|
| Spreadsheet software | 89.7% | 2,370,770 |
| Office suite software | 86.0% | 2,272,040 |
| Word processing software | 83.9% | 2,217,020 |
| Electronic mail software | 83.7% | 2,212,070 |
| Data base user interface and query software | 70.1% | 1,852,260 |
| Internet browser software | 62.5% | 1,650,310 |
| Web page creation and editing software | 57.3% | 1,515,040 |
| Presentation software | 55.8% | 1,475,410 |
| Operating system software | 53.3% | 1,407,010 |
| Desktop publishing software | 50.6% | 1,337,770 |
| Project management software | 38.4% | 1,013,550 |
| Instant messaging software | 37.9% | 1,001,540 |
| Enterprise resource planning ERP software | 36.9% | 975,060 |
| Accounting software | 32.8% | 867,360 |
| Calendar and scheduling software | 31.3% | 825,950 |
Reach = share of industry employment in occupations where the requirement is significant; it is not a per-worker usage or proficiency measure. Skill, knowledge, and ability importance is from O*NET; tool use is reported presence of a technology category.
Largest occupations
The occupations that employ the most people in this industry, with their share of the industry's workforce and national median pay for the occupation (not industry-specific pay).
Showing the top 40 of 378 occupations by employment.
Most distinctive occupations
The occupations most unusually concentrated in this industry compared with the economy as a whole. The location quotient is how many times more common an occupation is here versus its economy-wide share (a value of 5 means five times as concentrated).
For a sector this broad, the location quotient has a ceiling set by the sector's own share of national employment, so the top values tend to cluster near that limit.
Sub-industries
More detailed industries within Arts, Entertainment, and Recreation.
Write a report on thisheadline · factoids · citation
The Arts, Entertainment, and Recreation workforce sits at the 44th percentile of AI task overlap — 2,642,240 U.S. workers
- Weighting every occupation by its real share of Arts, Entertainment, and Recreation employment, the industry's workforce ranks in the 44th percentile (Moderate band) for AI task overlap — overlap with what AI can attempt, not a measure of jobs at risk.Eloundou et al. + Felten AIOE, weighted by BLS OEWS
- The industry employs about 2,642,240 U.S. workers across 378 occupations.BLS OEWS (May 2024)
- Employment-weighted typical annual pay is about $43,730.BLS OEWS (May 2024)
- Of AI use observed across this industry's occupations, 48% looks like augmentation rather than automation — from a Claude.ai sample, not a census.Anthropic Economic Index
The Arts, Entertainment, and Recreation workforce sits at the 44th percentile of AI task overlap — 2,642,240 U.S. workers

• Weighting every occupation by its real share of Arts, Entertainment, and Recreation employment, the industry's workforce ranks in the 44th percentile (Moderate band) for AI task overlap — overlap with what AI can attempt, not a measure of jobs at risk. (Eloundou et al. + Felten AIOE, weighted by BLS OEWS)
• The industry employs about 2,642,240 U.S. workers across 378 occupations. (BLS OEWS (May 2024))
• Employment-weighted typical annual pay is about $43,730. (BLS OEWS (May 2024))
• Of AI use observed across this industry's occupations, 48% looks like augmentation rather than automation — from a Claude.ai sample, not a census. (Anthropic Economic Index)

Source: Singulariki — "Arts, Entertainment, and Recreation". https://singulariki.com/industries/71
Note: AI task overlap measures what today's AI can attempt, not automation, job loss, or a forecast.
AssetsShare imageMethodology & sourcesPress & newsroomThe newsroom
Every line is built only from figures this page already shows and cites. AI task overlap means what today's AI can attempt — not automation, job loss, or a forecast.
Sources for this page
Every figure above traces to a named public dataset and the exact release below — not hand-written opinion. See the full methodology for what each measure does and does not mean.
- O*NET 30.3 U.S. Department of Labor / National Center for O*NET Development
- BLS Occupational Employment and Wage Statistics (OEWS) May 2024 U.S. Bureau of Labor Statistics
- Census NAICS 2022 U.S. Census Bureau
- Anthropic Economic Index v4 (2026-01-15) + v2 (2025-03-27) Anthropic
- “GPTs are GPTs” (Eloundou et al.) arXiv 2303.10130 OpenAI / academic
- AI Occupational Exposure (AIOE) Felten, Raj & Seamans academic
Data compiled June 3, 2026. Figures are estimates, not advice.
Cite this page
Singulariki. "Arts, Entertainment, and Recreation." Singulariki: a source-backed encyclopedia of work. Built from O*NET 30.3; BLS Occupational Employment and Wage Statistics (OEWS) May 2024; Census NAICS 2022; Anthropic Economic Index v4 (2026-01-15) + v2 (2025-03-27); “GPTs are GPTs” (Eloundou et al.) arXiv 2303.10130; AI Occupational Exposure (AIOE) Felten, Raj & Seamans. Accessed June 7, 2026. https://singulariki.com/industries/71
Singulariki. (2026). Arts, Entertainment, and Recreation. Singulariki: a source-backed encyclopedia of work. Retrieved June 7, 2026, from https://singulariki.com/industries/71
@misc{singulariki-71,
  title  = {Arts, Entertainment, and Recreation},
  author = {{Singulariki}},
  year   = {2026},
  note   = {O*NET 30.3; BLS Occupational Employment and Wage Statistics (OEWS) May 2024; Census NAICS 2022; Anthropic Economic Index v4 (2026-01-15) + v2 (2025-03-27); “GPTs are GPTs” (Eloundou et al.) arXiv 2303.10130; AI Occupational Exposure (AIOE) Felten, Raj & Seamans. Accessed June 7, 2026},
  url    = {https://singulariki.com/industries/71}
} Citations name the underlying public dataset releases — they reflect what this page is built from, not just the URL.