Radio Broadcasting Stations
National industry · NAICS 516110
A source-stamped Markdown brief of this occupation — paste it into an agent, or fetch
/industries/516110/context.md directly.
Radio Broadcasting Stations is a U.S. industry in the NAICS classification. The Bureau of Labor Statistics estimates about 51,780 workers across 71 detailed occupations in it. A typical worker earns around $54,213 a year (Singulariki estimate, see below).
This industry comprises establishments primarily engaged in broadcasting aural programs by radio to the public. These establishments operate radio broadcasting studios and facilities for the programming and transmission of programs to the public. Programming may originate in their own studio, from an affiliated network, or from external sources. Cross-References. Establishments primarily engaged in--
Employment is national May 2024 OEWS. "Typical pay" is Singulariki's own figure — the employment-weighted average of each occupation's national median wage — a rough center of the industry, not an official BLS number.
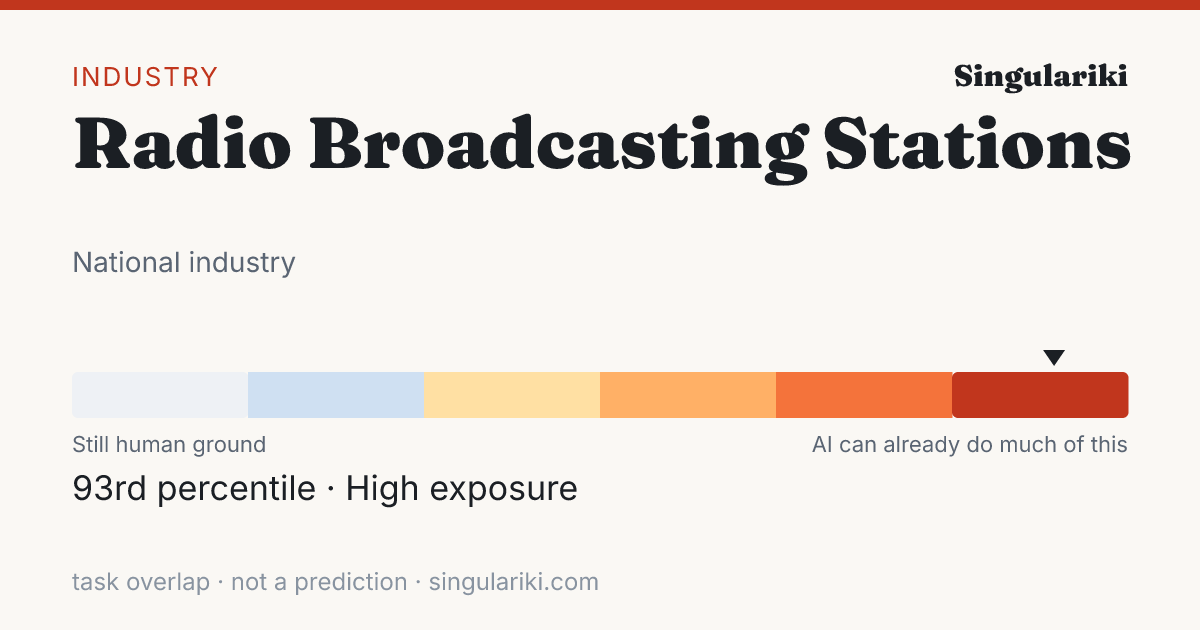
How exposed this industry is to AI
Weighting every occupation in this industry by its employment and its unified AI-exposure index (the OpenAI "GPTs are GPTs" human-rated task overlap folded with the Felten/Raj/Seamans AIOE index), this industry sits in the High band — 93rd percentile across all industries.
Exposure measures how much of the work overlaps with what today's AI can do, not a prediction of automation; high-exposure industries are where AI is most likely to reshape tasks. Employment-weighted across 65 occupations that carry an exposure score. Compare every industry on the AI exposure hub.
How AI is actually used in this industry
Among measured Claude.ai (Free and Pro) conversations mapped to O*NET task statements (Anthropic Economic Index, 2026-01-15), these patterns are most associated with the occupations in this industry, weighted by its employment mix. They are shares of observed AI conversations — not of worker time, revenue, or what could be automated — and reflect one AI assistant's consumer sample, not all AI.
| Signal coverage | 90.3% of employment · 48/69 occupations have AEI task data |
| Augmentation vs. automation | 45.8% working with AI · 41.1% handed to AI |
| Most common pattern | Directive · AI does it; you give the instruction |
| Typical AI autonomy | 3.6 / 5 · higher = AI acts more independently |
Tasks driving the signal
The task families that account for the most AI activity across this industry's occupations (employment × observed usage), each attributed to the occupation it comes from.
| Task | Occupation | How | Share of signal |
|---|---|---|---|
| Troubleshoot problems involving office equipment, such as computer hardware and software. | Office Clerks, General | Feedback loop | 24.4% |
| Prepare, rewrite and edit copy to improve readability, or supervise others who do this work. | Editors | Iteration | 9.1% |
| Consult with writers, producers, or actors about script changes or "workshop" scripts, through rehearsal with writers and actors to create final drafts. | Producers and Directors | Iteration | 4.6% |
| Select program content, in conjunction with producers and assistants, based on factors such as program specialties, audience tastes, or requests from the public. | Broadcast Announcers and Radio Disc Jockeys | Directive | 4.5% |
| Use computers for various applications, such as database management or word processing. | Secretaries and Administrative Assistants, Except Legal, Medical, and Executive | Directive | 3.5% |
| Conduct searches to find needed information, using such sources as the Internet. | Secretaries and Administrative Assistants, Except Legal, Medical, and Executive | Directive | 3.3% |
| Develop or maintain internal or external company Web sites. | Secretaries and Administrative Assistants, Except Legal, Medical, and Executive | Directive | 2.5% |
| Compose and edit scripts or provide screenwriters with story outlines from which scripts can be written. | Producers and Directors | Iteration | 2.4% |
| Compile scripts, program notes, and other material related to productions. | Producers and Directors | Directive | 2.2% |
| Prepare or edit organizational publications, such as employee newsletters or stockholders' reports, for internal or external audiences. | Public Relations Specialists | Iteration | 2.1% |
| Develop factors such as themes, plots, characterizations, psychological analyses, historical environments, action, and dialogue, to create material. | Writers and Authors | Directive | 1.8% |
| Write and edit news stories from information collected by reporters and other sources. | Producers and Directors | Directive | 1.7% |
Occupations behind the signal
The occupations whose AI-touched tasks contribute most to this industry's signal, by employment here.
| Occupation | Workers | Share | How they use AI |
|---|---|---|---|
| Broadcast Announcers and Radio Disc Jockeys | 13,710 | 26.5% | Directive |
| Advertising Sales Agents | 7,510 | 14.5% | Iteration |
| Producers and Directors | 5,500 | 10.6% | Iteration |
| Broadcast Technicians | 3,850 | 7.4% | Directive |
| General and Operations Managers | 2,820 | 5.5% | Iteration |
| Office Clerks, General | 1,630 | 3.1% | Feedback loop |
| Market Research Analysts and Marketing Specialists | 1,120 | 2.2% | Directive |
| Secretaries and Administrative Assistants, Except Legal, Medical, and Executive | 1,050 | 2.0% | Directive |
| Sales Managers | 780 | 1.5% | Iteration |
| Public Relations Specialists | 730 | 1.4% | Iteration |
| Bookkeeping, Accounting, and Auditing Clerks | 720 | 1.4% | Directive |
| Meeting, Convention, and Event Planners | 550 | 1.1% | Iteration |
This rollup is only as complete as the occupation-task matches available for the industry; the coverage figure above is shown so sparse industries do not look falsely precise. AI exposure is not the same as replacement.
Skill & tool metabolism
What this industry's work actually runs on. Each figure is the share of the industry's workers in occupations that significantly rely on a skill, knowledge area, or ability (O*NET importance ≥ 3 of 5), or that use a tool category — its employment reach. This is a measure of how widespread a requirement is across the workforce, not how intensively any one worker uses it. Shares are independent and need not add to 100%.
Based on 96.0% of this industry's employment that maps to a detailed occupation with an O*NET skill profile.
Skills
| Skill | Employment reach | Workers |
|---|---|---|
| Active Listening | 96.0% | 49,700 |
| Speaking | 96.0% | 49,700 |
| Critical Thinking | 95.8% | 49,580 |
| Reading Comprehension | 95.8% | 49,610 |
| Writing | 95.2% | 49,290 |
| Time Management | 94.9% | 49,120 |
| Coordination | 93.1% | 48,190 |
| Social Perceptiveness | 92.3% | 47,790 |
| Monitoring | 91.7% | 47,460 |
| Judgment and Decision Making | 89.0% | 46,100 |
| Complex Problem Solving | 87.7% | 45,400 |
| Active Learning | 72.1% | 37,340 |
Knowledge areas
| Knowledge area | Employment reach | Workers |
|---|---|---|
| English Language | 95.8% | 49,610 |
| Computers and Electronics | 86.2% | 44,630 |
| Communications and Media | 75.8% | 39,250 |
| Customer and Personal Service | 60.9% | 31,520 |
| Administration and Management | 52.9% | 27,370 |
| Telecommunications | 50.1% | 25,920 |
| Administrative | 38.0% | 19,690 |
| Mathematics | 31.0% | 16,060 |
| Sales and Marketing | 23.9% | 12,380 |
| Economics and Accounting | 13.5% | 7,010 |
| Engineering and Technology | 10.5% | 5,440 |
| Personnel and Human Resources | 9.8% | 5,060 |
Abilities
| Abilitie | Employment reach | Workers |
|---|---|---|
| Near Vision | 96.0% | 49,700 |
| Oral Comprehension | 96.0% | 49,700 |
| Oral Expression | 96.0% | 49,700 |
| Speech Clarity | 95.8% | 49,610 |
| Speech Recognition | 95.8% | 49,610 |
| Written Comprehension | 95.4% | 49,410 |
| Written Expression | 95.4% | 49,410 |
| Deductive Reasoning | 95.0% | 49,180 |
| Inductive Reasoning | 95.0% | 49,180 |
| Information Ordering | 95.0% | 49,180 |
| Problem Sensitivity | 95.0% | 49,180 |
| Category Flexibility | 90.9% | 47,070 |
Tool categories
| Tool category | Employment reach | Workers |
|---|---|---|
| Office suite software | 99.0% | 51,270 |
| Spreadsheet software | 99.0% | 51,270 |
| Word processing software | 98.8% | 51,160 |
| Presentation software | 98.6% | 51,030 |
| Electronic mail software | 97.8% | 50,660 |
| Data base user interface and query software | 87.3% | 45,210 |
| Internet browser software | 84.0% | 43,500 |
| Enterprise resource planning ERP software | 80.5% | 41,660 |
| Analytical or scientific software | 77.2% | 40,000 |
| Desktop publishing software | 67.6% | 34,990 |
| Graphics or photo imaging software | 66.7% | 34,560 |
| Enterprise application integration software | 59.6% | 30,860 |
| Customer relationship management CRM software | 56.8% | 29,390 |
| Web page creation and editing software | 56.8% | 29,410 |
| Video conferencing software | 55.2% | 28,590 |
Reach = share of industry employment in occupations where the requirement is significant; it is not a per-worker usage or proficiency measure. Skill, knowledge, and ability importance is from O*NET; tool use is reported presence of a technology category.
Largest occupations
The occupations that employ the most people in this industry, with their share of the industry's workforce and national median pay for the occupation (not industry-specific pay).
Showing the top 40 of 71 occupations by employment.
Most distinctive occupations
The occupations most unusually concentrated in this industry compared with the economy as a whole. The location quotient is how many times more common an occupation is here versus its economy-wide share (a value of 5 means five times as concentrated).
| Occupation | Concentration | Workers |
|---|---|---|
| Broadcast Announcers and Radio Disc Jockeys | 1709.57× | 13,710 |
| Broadcast Technicians | 543.84× | 3,850 |
| Advertising Sales Agents | 229.43× | 7,510 |
| News Analysts, Reporters, and Journalists | 131.15× | 1,830 |
| Producers and Directors | 112.74× | 5,500 |
| Sound Engineering Technicians | 93.55× | 410 |
| Disc Jockeys, Except Radio | 54.67× | 150 |
| Media and Communication Workers, All Other | 35.34× | 280 |
| Camera Operators, Television, Video, and Film | 24.35× | 200 |
| Advertising and Promotions Managers | 23.99× | 170 |
| Audio and Video Technicians | 19.12× | 450 |
| Editors | 15.91× | 510 |
| Meeting, Convention, and Event Planners | 12.16× | 550 |
| Fundraisers | 8.43× | 300 |
| Public Relations Specialists | 7.75× | 730 |
| Writers and Authors | 7.48× | 120 |
| Market Research Analysts and Marketing Specialists | 3.87× | 1,120 |
| Sales Managers | 3.85× | 780 |
| First-Line Supervisors of Non-Retail Sales Workers | 3.81× | 280 |
| Web and Digital Interface Designers | 3.47× | 130 |
Write a report on thisheadline · factoids · citation
The Radio Broadcasting Stations workforce sits at the 93rd percentile of AI task overlap — 51,780 U.S. workers
- Weighting every occupation by its real share of Radio Broadcasting Stations employment, the industry's workforce ranks in the 93rd percentile (High band) for AI task overlap — overlap with what AI can attempt, not a measure of jobs at risk.Eloundou et al. + Felten AIOE, weighted by BLS OEWS
- The industry employs about 51,780 U.S. workers across 71 occupations.BLS OEWS (May 2024)
- Employment-weighted typical annual pay is about $54,213.BLS OEWS (May 2024)
- Of AI use observed across this industry's occupations, 46% looks like augmentation rather than automation — from a Claude.ai sample, not a census.Anthropic Economic Index
The Radio Broadcasting Stations workforce sits at the 93rd percentile of AI task overlap — 51,780 U.S. workers

• Weighting every occupation by its real share of Radio Broadcasting Stations employment, the industry's workforce ranks in the 93rd percentile (High band) for AI task overlap — overlap with what AI can attempt, not a measure of jobs at risk. (Eloundou et al. + Felten AIOE, weighted by BLS OEWS)
• The industry employs about 51,780 U.S. workers across 71 occupations. (BLS OEWS (May 2024))
• Employment-weighted typical annual pay is about $54,213. (BLS OEWS (May 2024))
• Of AI use observed across this industry's occupations, 46% looks like augmentation rather than automation — from a Claude.ai sample, not a census. (Anthropic Economic Index)

Source: Singulariki — "Radio Broadcasting Stations". https://singulariki.com/industries/516110
Note: AI task overlap measures what today's AI can attempt, not automation, job loss, or a forecast.
AssetsShare imageMethodology & sourcesPress & newsroomThe newsroom
Every line is built only from figures this page already shows and cites. AI task overlap means what today's AI can attempt — not automation, job loss, or a forecast.
Sources for this page
Every figure above traces to a named public dataset and the exact release below — not hand-written opinion. See the full methodology for what each measure does and does not mean.
- O*NET 30.3 U.S. Department of Labor / National Center for O*NET Development
- BLS Occupational Employment and Wage Statistics (OEWS) May 2024 U.S. Bureau of Labor Statistics
- Census NAICS 2022 U.S. Census Bureau
- Anthropic Economic Index v4 (2026-01-15) + v2 (2025-03-27) Anthropic
- “GPTs are GPTs” (Eloundou et al.) arXiv 2303.10130 OpenAI / academic
- AI Occupational Exposure (AIOE) Felten, Raj & Seamans academic
Data compiled June 3, 2026. Figures are estimates, not advice.
Cite this page
Singulariki. "Radio Broadcasting Stations." Singulariki: a source-backed encyclopedia of work. Built from O*NET 30.3; BLS Occupational Employment and Wage Statistics (OEWS) May 2024; Census NAICS 2022; Anthropic Economic Index v4 (2026-01-15) + v2 (2025-03-27); “GPTs are GPTs” (Eloundou et al.) arXiv 2303.10130; AI Occupational Exposure (AIOE) Felten, Raj & Seamans. Accessed June 7, 2026. https://singulariki.com/industries/516110
Singulariki. (2026). Radio Broadcasting Stations. Singulariki: a source-backed encyclopedia of work. Retrieved June 7, 2026, from https://singulariki.com/industries/516110
@misc{singulariki-516110,
  title  = {Radio Broadcasting Stations},
  author = {{Singulariki}},
  year   = {2026},
  note   = {O*NET 30.3; BLS Occupational Employment and Wage Statistics (OEWS) May 2024; Census NAICS 2022; Anthropic Economic Index v4 (2026-01-15) + v2 (2025-03-27); “GPTs are GPTs” (Eloundou et al.) arXiv 2303.10130; AI Occupational Exposure (AIOE) Felten, Raj & Seamans. Accessed June 7, 2026},
  url    = {https://singulariki.com/industries/516110}
} Citations name the underlying public dataset releases — they reflect what this page is built from, not just the URL.