Construction
Sector · NAICS 23
A source-stamped Markdown brief of this occupation — paste it into an agent, or fetch
/industries/23/context.md directly.
Construction is a U.S. industry in the NAICS classification. The Bureau of Labor Statistics estimates about 8,121,640 workers across 390 detailed occupations in it. A typical worker earns around $63,986 a year (Singulariki estimate, see below).
The Sector as a Whole The Construction sector comprises establishments primarily engaged in the construction of buildings or engineering projects (e.g., highways and utility systems). Establishments primarily engaged in the preparation of sites for new construction and establishments primarily engaged in subdividing land for sale as building sites also are included in this sector. Construction work done may include new work, additions, alterations, or maintenance and repairs. Activities of these establishments generally are managed at a fixed place of business, but they usually perform construction activities at multiple project sites. Production responsibilities for establishments in this sector are usually specified in (1) contracts with the owners of construction projects (prime contracts) or (2) contracts with other construction establishments (subcontracts). Establishments primarily engaged in contracts that include responsibility for all aspects of individual construction projects are commonly known as general contractors, but also may be known as design-builders, construction managers, turnkey contractors, or (in cases where two or more establishments jointly secure a general contract) joint-venture contractors. Construction managers that provide oversight and scheduling only (i.e., agency) as well as construction managers that are responsible for the entire project (i.e., at risk) are included as general contractor type establishments. Establishments of the "general contractor type" frequently arrange construction of separate parts of their projects through subcontracts with other construction establishments. Establishments primarily engaged in activities to produce a specific component (e.g., masonry, painting, and electrical work) of a construction project are commonly known as specialty trade contractors. Activities of specialty trade contractors are usually subcontracted from other construction establishments, but especially in remodeling and repair construction, the work may be done directly for the owner of the property. Establishments primarily engaged in activities to construct buildings to be sold on sites that they own are known as for-sale builders, but also may be known as speculative builders or merchant builders. For-sale builders produce buildings in a manner similar to general contractors, but their production processes also include site acquisition and securing of financial backing. For-sale builders are most often associated with the construction of residential buildings. Like general contractors, they may subcontract all or part of the actual construction work on their buildings. There are substantial differences in the types of equipment, work force skills, and other inputs required by establishments in this sector. To highlight these differences and variations in the underlying production functions, this sector is divided into three subsectors. Subsector 236, Construction of Buildings, comprises establishments of the general contractor type and for-sale builders involved in the construction of buildings. Subsector 237, Heavy and Civil Engineering Construction, comprises establishments involved in the construction of engineering projects. Subsector 238, Specialty Trade Contractors, comprises establishments engaged in specialty trade activities generally needed in the construction of all types of buildings. Force account construction is construction work performed by an enterprise primarily engaged in some business other than construction for its own account, using employees of the enterprise. This activity is not included in the construction sector unless the construction work performed is the primary activity of a separate establishment of the enterprise. The installation and the ongoing repair and maintenance of telecommunications and utility networks is excluded from construction when the establishments performing the work are not independent contractors. Although a growing proportion of this work is subcontracted to independent contractors in the Construction sector, the operating units of telecommunications and utility companies performing this work are included with the telecommunications or utility activities.
Employment is national May 2024 OEWS. "Typical pay" is Singulariki's own figure — the employment-weighted average of each occupation's national median wage — a rough center of the industry, not an official BLS number.
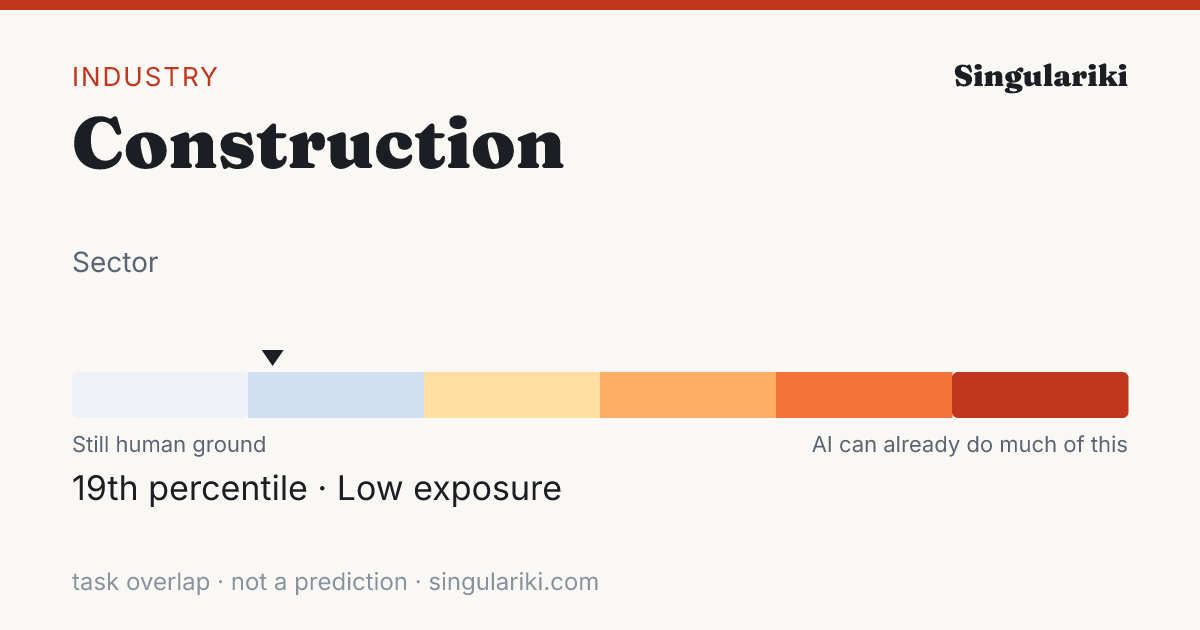
How exposed this industry is to AI
Weighting every occupation in this industry by its employment and its unified AI-exposure index (the OpenAI "GPTs are GPTs" human-rated task overlap folded with the Felten/Raj/Seamans AIOE index), this industry sits in the Low band — 19th percentile across all industries.
Exposure measures how much of the work overlaps with what today's AI can do, not a prediction of automation; high-exposure industries are where AI is most likely to reshape tasks. Employment-weighted across 340 occupations that carry an exposure score. Compare every industry on the AI exposure hub.
How AI is actually used in this industry
Among measured Claude.ai (Free and Pro) conversations mapped to O*NET task statements (Anthropic Economic Index, 2026-01-15), these patterns are most associated with the occupations in this industry, weighted by its employment mix. They are shares of observed AI conversations — not of worker time, revenue, or what could be automated — and reflect one AI assistant's consumer sample, not all AI.
| Signal coverage | 56.5% of employment · 171/365 occupations have AEI task data |
| Augmentation vs. automation | 37.7% working with AI · 33.4% handed to AI |
| Most common pattern | Directive · AI does it; you give the instruction |
| Typical AI autonomy | 3.4 / 5 · higher = AI acts more independently |
Tasks driving the signal
The task families that account for the most AI activity across this industry's occupations (employment × observed usage), each attributed to the occupation it comes from.
| Task | Occupation | How | Share of signal |
|---|---|---|---|
| Troubleshoot problems involving office equipment, such as computer hardware and software. | Office Clerks, General | Feedback loop | 49.4% |
| Use computers for various applications, such as database management or word processing. | Secretaries and Administrative Assistants, Except Legal, Medical, and Executive | Directive | 5.5% |
| Conduct searches to find needed information, using such sources as the Internet. | Secretaries and Administrative Assistants, Except Legal, Medical, and Executive | Directive | 5.1% |
| Develop or maintain internal or external company Web sites. | Secretaries and Administrative Assistants, Except Legal, Medical, and Executive | Directive | 3.8% |
| Process and prepare documents, such as business or government forms and expense reports. | Office Clerks, General | Directive | 2.0% |
| Participate in the work of subordinates to facilitate productivity or to overcome difficult aspects of work. | First-Line Supervisors of Office and Administrative Support Workers | Iteration | 1.7% |
| Complete work schedules, manage calendars, and arrange appointments. | Office Clerks, General | Directive | 1.2% |
| Diagnose malfunctioning systems, apparatus, or components, using test equipment and hand tools to locate the cause of a breakdown and correct the problem. | Electricians | Feedback loop | 1.0% |
| Classify, record, and summarize numerical and financial data to compile and keep financial records, using journals and ledgers or computers. | Bookkeeping, Accounting, and Auditing Clerks | Directive | 0.9% |
| Create, maintain, and enter information into databases. | Secretaries and Administrative Assistants, Except Legal, Medical, and Executive | Directive | 0.9% |
| Operate office machines, such as photocopiers and scanners, facsimile machines, voice mail systems, and personal computers. | Office Clerks, General | Learning | 0.9% |
| Review financial statements, sales or activity reports, or other performance data to measure productivity or goal achievement or to identify areas needing cost reduction or program improvement. | General and Operations Managers | Directive | 0.8% |
Occupations behind the signal
The occupations whose AI-touched tasks contribute most to this industry's signal, by employment here.
| Occupation | Workers | Share | How they use AI |
|---|---|---|---|
| First-Line Supervisors of Construction Trades and Extraction Workers | 629,040 | 7.8% | Directive |
| Electricians | 582,130 | 7.2% | Feedback loop |
| Plumbers, Pipefitters, and Steamfitters | 374,640 | 4.6% | Directive |
| Heating, Air Conditioning, and Refrigeration Mechanics and Installers | 302,390 | 3.7% | Learning |
| Construction Managers | 277,520 | 3.4% | Iteration |
| General and Operations Managers | 275,980 | 3.4% | Iteration |
| Office Clerks, General | 259,930 | 3.2% | Feedback loop |
| Cement Masons and Concrete Finishers | 192,080 | 2.4% | Learning |
| Heavy and Tractor-Trailer Truck Drivers | 133,840 | 1.7% | Directive |
| Roofers | 133,610 | 1.7% | — |
| Bookkeeping, Accounting, and Auditing Clerks | 129,360 | 1.6% | Directive |
| Secretaries and Administrative Assistants, Except Legal, Medical, and Executive | 128,640 | 1.6% | Directive |
This rollup is only as complete as the occupation-task matches available for the industry; the coverage figure above is shown so sparse industries do not look falsely precise. AI exposure is not the same as replacement.
Skill & tool metabolism
What this industry's work actually runs on. Each figure is the share of the industry's workers in occupations that significantly rely on a skill, knowledge area, or ability (O*NET importance ≥ 3 of 5), or that use a tool category — its employment reach. This is a measure of how widespread a requirement is across the workforce, not how intensively any one worker uses it. Shares are independent and need not add to 100%.
Based on 94.6% of this industry's employment that maps to a detailed occupation with an O*NET skill profile.
Skills
| Skill | Employment reach | Workers |
|---|---|---|
| Active Listening | 88.3% | 7,171,560 |
| Speaking | 82.5% | 6,704,230 |
| Critical Thinking | 76.2% | 6,184,670 |
| Coordination | 72.8% | 5,908,860 |
| Monitoring | 71.2% | 5,782,300 |
| Time Management | 70.8% | 5,747,210 |
| Reading Comprehension | 62.7% | 5,092,910 |
| Judgment and Decision Making | 58.0% | 4,706,770 |
| Complex Problem Solving | 56.0% | 4,548,000 |
| Quality Control Analysis | 46.4% | 3,771,700 |
| Active Learning | 46.1% | 3,746,180 |
| Operations Monitoring | 43.2% | 3,511,440 |
Knowledge areas
| Knowledge area | Employment reach | Workers |
|---|---|---|
| Customer and Personal Service | 69.1% | 5,610,450 |
| Mechanical | 66.4% | 5,388,980 |
| Building and Construction | 66.2% | 5,378,290 |
| Administration and Management | 62.9% | 5,105,430 |
| Mathematics | 62.2% | 5,055,070 |
| English Language | 59.5% | 4,835,290 |
| Public Safety and Security | 59.2% | 4,808,320 |
| Design | 46.0% | 3,733,920 |
| Education and Training | 28.9% | 2,345,550 |
| Engineering and Technology | 27.7% | 2,252,090 |
| Computers and Electronics | 23.0% | 1,867,610 |
| Administrative | 20.2% | 1,638,990 |
Abilities
| Abilitie | Employment reach | Workers |
|---|---|---|
| Near Vision | 94.0% | 7,632,900 |
| Oral Comprehension | 93.7% | 7,609,970 |
| Oral Expression | 92.5% | 7,515,130 |
| Deductive Reasoning | 91.0% | 7,387,950 |
| Problem Sensitivity | 90.4% | 7,342,110 |
| Information Ordering | 89.9% | 7,300,940 |
| Speech Recognition | 86.8% | 7,050,620 |
| Speech Clarity | 86.0% | 6,981,250 |
| Selective Attention | 78.0% | 6,336,900 |
| Category Flexibility | 77.3% | 6,281,980 |
| Manual Dexterity | 71.4% | 5,797,540 |
| Arm-Hand Steadiness | 71.2% | 5,778,710 |
Tool categories
| Tool category | Employment reach | Workers |
|---|---|---|
| Office suite software | 94.2% | 7,651,510 |
| Spreadsheet software | 93.7% | 7,611,940 |
| Word processing software | 86.7% | 7,040,010 |
| Project management software | 78.4% | 6,370,020 |
| Electronic mail software | 78.0% | 6,335,490 |
| Operating system software | 72.9% | 5,919,680 |
| Computer aided design CAD software | 68.8% | 5,591,300 |
| Data base user interface and query software | 64.9% | 5,274,550 |
| Enterprise resource planning ERP software | 52.3% | 4,248,100 |
| Analytical or scientific software | 51.5% | 4,182,250 |
| Accounting software | 49.1% | 3,990,460 |
| Presentation software | 47.6% | 3,866,720 |
| Document management software | 45.4% | 3,684,330 |
| Graphics or photo imaging software | 41.6% | 3,376,320 |
| Customer relationship management CRM software | 40.7% | 3,307,590 |
Reach = share of industry employment in occupations where the requirement is significant; it is not a per-worker usage or proficiency measure. Skill, knowledge, and ability importance is from O*NET; tool use is reported presence of a technology category.
Largest occupations
The occupations that employ the most people in this industry, with their share of the industry's workforce and national median pay for the occupation (not industry-specific pay).
Showing the top 40 of 390 occupations by employment.
Most distinctive occupations
The occupations most unusually concentrated in this industry compared with the economy as a whole. The location quotient is how many times more common an occupation is here versus its economy-wide share (a value of 5 means five times as concentrated).
For a sector this broad, the location quotient has a ceiling set by the sector's own share of national employment, so the top values tend to cluster near that limit.
| Occupation | Concentration | Workers |
|---|---|---|
| Tapers | 18.82× | 12,390 |
| Terrazzo Workers and Finishers | 18.72× | 1,430 |
| Helpers--Roofers | 18.65× | 5,080 |
| Helpers--Brickmasons, Blockmasons, Stonemasons, and Tile and Marble Setters | 18.57× | 15,320 |
| Roofers | 18.55× | 133,610 |
| Drywall and Ceiling Tile Installers | 18.52× | 80,860 |
| Helpers--Pipelayers, Plumbers, Pipefitters, and Steamfitters | 18.26× | 41,970 |
| Insulation Workers, Floor, Ceiling, and Wall | 18.07× | 36,760 |
| Pile Driver Operators | 18.05× | 2,890 |
| Brickmasons and Blockmasons | 17.97× | 50,650 |
| Plasterers and Stucco Masons | 17.81× | 19,590 |
| Cement Masons and Concrete Finishers | 17.77× | 192,080 |
| Helpers--Painters, Paperhangers, Plasterers, and Stucco Masons | 17.64× | 6,710 |
| Floor Sanders and Finishers | 17.61× | 3,840 |
| Helpers--Electricians | 17.53× | 59,490 |
| Insulation Workers, Mechanical | 17.07× | 23,060 |
| Helpers--Carpenters | 16.81× | 21,790 |
| Fence Erectors | 16.78× | 20,010 |
| Reinforcing Iron and Rebar Workers | 16.33× | 12,160 |
| Carpenters | 16.17× | 594,410 |
Sub-industries
More detailed industries within Construction.
- Drywall and Insulation Contractors
- Electrical Contractors and Other Wiring Installation Contractors
- Masonry Contractors
- Other Building Equipment Contractors
- Painting and Wall Covering Contractors
- Plumbing, Heating, and Air-Conditioning Contractors
- Poured Concrete Foundation and Structure Contractors
- Power and Communication Line and Related Structures Construction
- Roofing Contractors
Write a report on thisheadline · factoids · citation
The Construction workforce sits at the 19th percentile of AI task overlap — 8,121,640 U.S. workers
- Weighting every occupation by its real share of Construction employment, the industry's workforce ranks in the 19th percentile (Low band) for AI task overlap — overlap with what AI can attempt, not a measure of jobs at risk.Eloundou et al. + Felten AIOE, weighted by BLS OEWS
- The industry employs about 8,121,640 U.S. workers across 390 occupations.BLS OEWS (May 2024)
- Employment-weighted typical annual pay is about $63,986.BLS OEWS (May 2024)
- Of AI use observed across this industry's occupations, 38% looks like augmentation rather than automation — from a Claude.ai sample, not a census.Anthropic Economic Index
The Construction workforce sits at the 19th percentile of AI task overlap — 8,121,640 U.S. workers

• Weighting every occupation by its real share of Construction employment, the industry's workforce ranks in the 19th percentile (Low band) for AI task overlap — overlap with what AI can attempt, not a measure of jobs at risk. (Eloundou et al. + Felten AIOE, weighted by BLS OEWS)
• The industry employs about 8,121,640 U.S. workers across 390 occupations. (BLS OEWS (May 2024))
• Employment-weighted typical annual pay is about $63,986. (BLS OEWS (May 2024))
• Of AI use observed across this industry's occupations, 38% looks like augmentation rather than automation — from a Claude.ai sample, not a census. (Anthropic Economic Index)

Source: Singulariki — "Construction". https://singulariki.com/industries/23
Note: AI task overlap measures what today's AI can attempt, not automation, job loss, or a forecast.
AssetsShare imageMethodology & sourcesPress & newsroomThe newsroom
Every line is built only from figures this page already shows and cites. AI task overlap means what today's AI can attempt — not automation, job loss, or a forecast.
Sources for this page
Every figure above traces to a named public dataset and the exact release below — not hand-written opinion. See the full methodology for what each measure does and does not mean.
- O*NET 30.3 U.S. Department of Labor / National Center for O*NET Development
- BLS Occupational Employment and Wage Statistics (OEWS) May 2024 U.S. Bureau of Labor Statistics
- Census NAICS 2022 U.S. Census Bureau
- Anthropic Economic Index v4 (2026-01-15) + v2 (2025-03-27) Anthropic
- “GPTs are GPTs” (Eloundou et al.) arXiv 2303.10130 OpenAI / academic
- AI Occupational Exposure (AIOE) Felten, Raj & Seamans academic
Data compiled June 3, 2026. Figures are estimates, not advice.
Cite this page
Singulariki. "Construction." Singulariki: a source-backed encyclopedia of work. Built from O*NET 30.3; BLS Occupational Employment and Wage Statistics (OEWS) May 2024; Census NAICS 2022; Anthropic Economic Index v4 (2026-01-15) + v2 (2025-03-27); “GPTs are GPTs” (Eloundou et al.) arXiv 2303.10130; AI Occupational Exposure (AIOE) Felten, Raj & Seamans. Accessed June 7, 2026. https://singulariki.com/industries/23
Singulariki. (2026). Construction. Singulariki: a source-backed encyclopedia of work. Retrieved June 7, 2026, from https://singulariki.com/industries/23
@misc{singulariki-23,
  title  = {Construction},
  author = {{Singulariki}},
  year   = {2026},
  note   = {O*NET 30.3; BLS Occupational Employment and Wage Statistics (OEWS) May 2024; Census NAICS 2022; Anthropic Economic Index v4 (2026-01-15) + v2 (2025-03-27); “GPTs are GPTs” (Eloundou et al.) arXiv 2303.10130; AI Occupational Exposure (AIOE) Felten, Raj & Seamans. Accessed June 7, 2026},
  url    = {https://singulariki.com/industries/23}
} Citations name the underlying public dataset releases — they reflect what this page is built from, not just the URL.