Theater Companies and Dinner Theaters
National industry · NAICS 711110
A source-stamped Markdown brief of this occupation — paste it into an agent, or fetch
/industries/711110/context.md directly.
Theater Companies and Dinner Theaters is a U.S. industry in the NAICS classification. The Bureau of Labor Statistics estimates about 72,390 workers across 125 detailed occupations in it. A typical worker earns around $51,911 a year (Singulariki estimate, see below).
This industry comprises (1) companies, groups, or theaters primarily engaged in producing the following live theatrical presentations: musicals; operas; plays; and comedy, improvisational, mime, and puppet shows and (2) establishments, commonly known as dinner theaters, engaged in producing live theatrical productions and in providing food and beverages for consumption on the premises. Theater groups or companies may or may not operate their own theater or other facility for staging their shows. Illustrative Examples: Comedy troupes Opera companies Live theatrical productions (except dance) Theatrical stock or repertory companies Musical theater companies Cross-References.
Employment is national May 2024 OEWS. "Typical pay" is Singulariki's own figure — the employment-weighted average of each occupation's national median wage — a rough center of the industry, not an official BLS number.
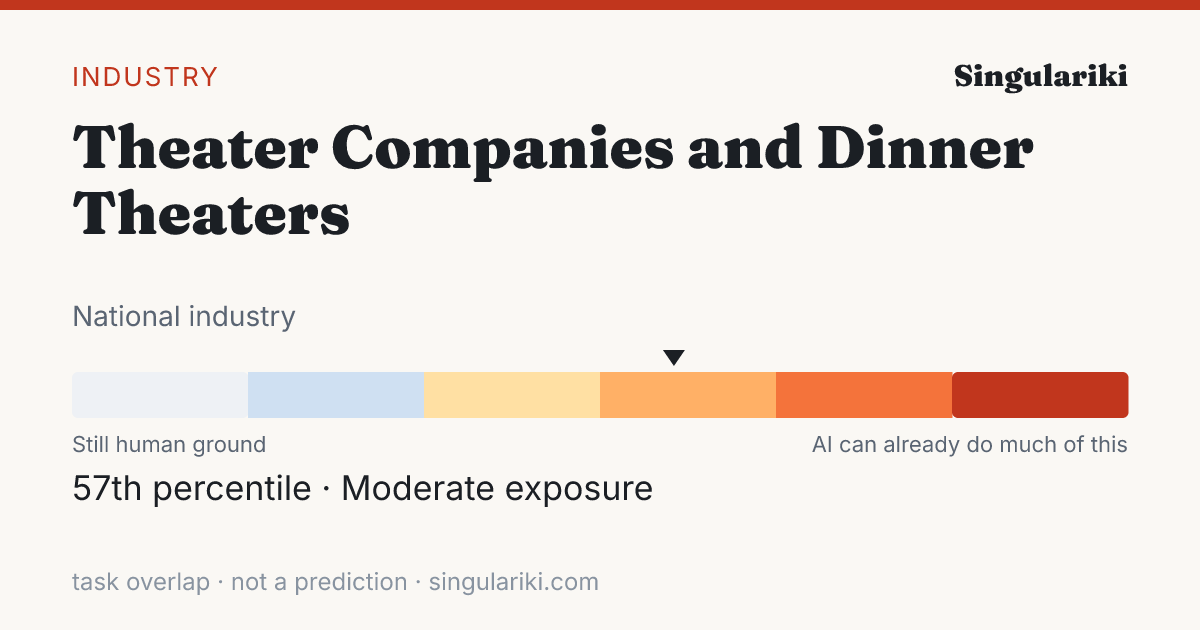
How exposed this industry is to AI
Weighting every occupation in this industry by its employment and its unified AI-exposure index (the OpenAI "GPTs are GPTs" human-rated task overlap folded with the Felten/Raj/Seamans AIOE index), this industry sits in the Moderate band — 57th percentile across all industries.
Exposure measures how much of the work overlaps with what today's AI can do, not a prediction of automation; high-exposure industries are where AI is most likely to reshape tasks. Employment-weighted across 110 occupations that carry an exposure score. Compare every industry on the AI exposure hub.
How AI is actually used in this industry
Among measured Claude.ai (Free and Pro) conversations mapped to O*NET task statements (Anthropic Economic Index, 2026-01-15), these patterns are most associated with the occupations in this industry, weighted by its employment mix. They are shares of observed AI conversations — not of worker time, revenue, or what could be automated — and reflect one AI assistant's consumer sample, not all AI.
| Signal coverage | 74.9% of employment · 75/121 occupations have AEI task data |
| Augmentation vs. automation | 45.1% working with AI · 36.8% handed to AI |
| Most common pattern | Directive · AI does it; you give the instruction |
| Typical AI autonomy | 3.7 / 5 · higher = AI acts more independently |
Tasks driving the signal
The task families that account for the most AI activity across this industry's occupations (employment × observed usage), each attributed to the occupation it comes from.
| Task | Occupation | How | Share of signal |
|---|---|---|---|
| Write original or adapted material for dramas, comedies, puppet shows, narration, or other performances. | Actors | Directive | 30.2% |
| Troubleshoot problems involving office equipment, such as computer hardware and software. | Office Clerks, General | Feedback loop | 8.0% |
| Answer customers' questions, and provide information on procedures or policies. | Cashiers | Directive | 6.4% |
| Conduct classes, workshops, and demonstrations, and provide individual instruction to teach topics and skills such as cooking, dancing, writing, physical fitness, photography, personal finance, and flying. | Self-Enrichment Teachers | Learning | 4.6% |
| Portray and interpret roles, using speech, gestures, and body movements, to entertain, inform, or instruct radio, film, television, or live audiences. | Actors | Directive | 3.7% |
| Consult with writers, producers, or actors about script changes or "workshop" scripts, through rehearsal with writers and actors to create final drafts. | Producers and Directors | Iteration | 2.2% |
| Review instructional content, methods, and student evaluations to assess strengths and weaknesses, and to develop recommendations for course revision, development, or elimination. | Self-Enrichment Teachers | Iteration | 1.5% |
| Use computers for various applications, such as database management or word processing. | Secretaries and Administrative Assistants, Except Legal, Medical, and Executive | Directive | 1.5% |
| Conduct searches to find needed information, using such sources as the Internet. | Secretaries and Administrative Assistants, Except Legal, Medical, and Executive | Directive | 1.4% |
| Compose and edit scripts or provide screenwriters with story outlines from which scripts can be written. | Producers and Directors | Iteration | 1.1% |
| Develop instructional materials to be used by educators and instructors. | Instructional Coordinators | Iteration | 1.1% |
| Use computers, audio-visual aids, and other equipment and materials to supplement presentations. | Self-Enrichment Teachers | Learning | 1.1% |
Occupations behind the signal
The occupations whose AI-touched tasks contribute most to this industry's signal, by employment here.
| Occupation | Workers | Share | How they use AI |
|---|---|---|---|
| Actors | 6,340 | 8.8% | Directive |
| Producers and Directors | 5,550 | 7.7% | Iteration |
| General and Operations Managers | 3,260 | 4.5% | Iteration |
| Waiters and Waitresses | 3,120 | 4.3% | Directive |
| Self-Enrichment Teachers | 3,100 | 4.3% | Learning |
| Musicians and Singers | 2,520 | 3.5% | Iteration |
| Bartenders | 2,250 | 3.1% | Directive |
| Cashiers | 1,940 | 2.7% | Directive |
| Set and Exhibit Designers | 1,880 | 2.6% | Directive |
| Costume Attendants | 1,880 | 2.6% | — |
| Customer Service Representatives | 1,240 | 1.7% | Directive |
| Audio and Video Technicians | 1,200 | 1.7% | Iteration |
This rollup is only as complete as the occupation-task matches available for the industry; the coverage figure above is shown so sparse industries do not look falsely precise. AI exposure is not the same as replacement.
Skill & tool metabolism
What this industry's work actually runs on. Each figure is the share of the industry's workers in occupations that significantly rely on a skill, knowledge area, or ability (O*NET importance ≥ 3 of 5), or that use a tool category — its employment reach. This is a measure of how widespread a requirement is across the workforce, not how intensively any one worker uses it. Shares are independent and need not add to 100%.
Based on 95.2% of this industry's employment that maps to a detailed occupation with an O*NET skill profile.
Skills
| Skill | Employment reach | Workers |
|---|---|---|
| Active Listening | 93.5% | 67,720 |
| Speaking | 87.9% | 63,640 |
| Social Perceptiveness | 78.9% | 57,130 |
| Monitoring | 73.2% | 53,010 |
| Coordination | 71.3% | 51,590 |
| Critical Thinking | 68.9% | 49,910 |
| Reading Comprehension | 67.7% | 49,000 |
| Time Management | 59.6% | 43,130 |
| Service Orientation | 55.2% | 39,970 |
| Active Learning | 47.0% | 34,030 |
| Judgment and Decision Making | 46.2% | 33,450 |
| Writing | 46.0% | 33,280 |
Knowledge areas
| Knowledge area | Employment reach | Workers |
|---|---|---|
| English Language | 90.5% | 65,490 |
| Customer and Personal Service | 83.7% | 60,560 |
| Administration and Management | 47.5% | 34,390 |
| Communications and Media | 37.9% | 27,450 |
| Computers and Electronics | 33.3% | 24,110 |
| Administrative | 23.8% | 17,210 |
| Education and Training | 23.4% | 16,910 |
| Mathematics | 23.3% | 16,850 |
| Fine Arts | 23.0% | 16,630 |
| Sales and Marketing | 23.0% | 16,680 |
| Public Safety and Security | 21.2% | 15,360 |
| Production and Processing | 19.2% | 13,880 |
Abilities
| Abilitie | Employment reach | Workers |
|---|---|---|
| Near Vision | 95.2% | 68,910 |
| Oral Comprehension | 94.9% | 68,680 |
| Oral Expression | 94.5% | 68,400 |
| Speech Recognition | 88.7% | 64,180 |
| Speech Clarity | 88.1% | 63,790 |
| Problem Sensitivity | 83.4% | 60,380 |
| Information Ordering | 75.0% | 54,320 |
| Written Comprehension | 73.5% | 53,190 |
| Deductive Reasoning | 61.7% | 44,630 |
| Inductive Reasoning | 57.0% | 41,240 |
| Category Flexibility | 55.0% | 39,840 |
| Written Expression | 54.5% | 39,420 |
Tool categories
| Tool category | Employment reach | Workers |
|---|---|---|
| Spreadsheet software | 88.6% | 64,120 |
| Office suite software | 88.1% | 63,810 |
| Electronic mail software | 83.4% | 60,390 |
| Word processing software | 83.3% | 60,280 |
| Data base user interface and query software | 76.5% | 55,400 |
| Internet browser software | 69.5% | 50,310 |
| Operating system software | 65.9% | 47,680 |
| Web page creation and editing software | 65.6% | 47,520 |
| Presentation software | 64.7% | 46,860 |
| Video creation and editing software | 51.7% | 37,460 |
| Desktop publishing software | 44.7% | 32,360 |
| Instant messaging software | 43.8% | 31,740 |
| Project management software | 43.4% | 31,430 |
| Enterprise resource planning ERP software | 42.8% | 30,960 |
| Document management software | 41.6% | 30,120 |
Reach = share of industry employment in occupations where the requirement is significant; it is not a per-worker usage or proficiency measure. Skill, knowledge, and ability importance is from O*NET; tool use is reported presence of a technology category.
Largest occupations
The occupations that employ the most people in this industry, with their share of the industry's workforce and national median pay for the occupation (not industry-specific pay).
Showing the top 40 of 125 occupations by employment.
Most distinctive occupations
The occupations most unusually concentrated in this industry compared with the economy as a whole. The location quotient is how many times more common an occupation is here versus its economy-wide share (a value of 5 means five times as concentrated).
| Occupation | Concentration | Workers |
|---|---|---|
| Costume Attendants | 636.61× | 1,880 |
| Set and Exhibit Designers | 369.06× | 1,880 |
| Actors | 348.04× | 6,340 |
| Musicians and Singers | 139.96× | 2,520 |
| Choreographers | 117.98× | 190 |
| Lighting Technicians | 115.64× | 550 |
| Dancers | 103.44× | 440 |
| Sound Engineering Technicians | 94.66× | 580 |
| Producers and Directors | 81.37× | 5,550 |
| Ushers, Lobby Attendants, and Ticket Takers | 80.04× | 4,480 |
| Music Directors and Composers | 69.1× | 400 |
| Entertainers and Performers, Sports and Related Workers, All Other | 65.14× | 460 |
| Craft Artists | 58.49× | 120 |
| Fine Artists, Including Painters, Sculptors, and Illustrators | 57.51× | 270 |
| Entertainment Attendants and Related Workers, All Other | 42.28× | 160 |
| Audio and Video Technicians | 36.47× | 1,200 |
| Media and Communication Equipment Workers, All Other | 34.35× | 210 |
| Fashion Designers | 24.45× | 240 |
| Self-Enrichment Teachers | 21.4× | 3,100 |
| Fundraisers | 21.31× | 1,060 |
Write a report on thisheadline · factoids · citation
The Theater Companies and Dinner Theaters workforce sits at the 57th percentile of AI task overlap — 72,390 U.S. workers
- Weighting every occupation by its real share of Theater Companies and Dinner Theaters employment, the industry's workforce ranks in the 57th percentile (Moderate band) for AI task overlap — overlap with what AI can attempt, not a measure of jobs at risk.Eloundou et al. + Felten AIOE, weighted by BLS OEWS
- The industry employs about 72,390 U.S. workers across 125 occupations.BLS OEWS (May 2024)
- Employment-weighted typical annual pay is about $51,911.BLS OEWS (May 2024)
- Of AI use observed across this industry's occupations, 45% looks like augmentation rather than automation — from a Claude.ai sample, not a census.Anthropic Economic Index
The Theater Companies and Dinner Theaters workforce sits at the 57th percentile of AI task overlap — 72,390 U.S. workers

• Weighting every occupation by its real share of Theater Companies and Dinner Theaters employment, the industry's workforce ranks in the 57th percentile (Moderate band) for AI task overlap — overlap with what AI can attempt, not a measure of jobs at risk. (Eloundou et al. + Felten AIOE, weighted by BLS OEWS)
• The industry employs about 72,390 U.S. workers across 125 occupations. (BLS OEWS (May 2024))
• Employment-weighted typical annual pay is about $51,911. (BLS OEWS (May 2024))
• Of AI use observed across this industry's occupations, 45% looks like augmentation rather than automation — from a Claude.ai sample, not a census. (Anthropic Economic Index)

Source: Singulariki — "Theater Companies and Dinner Theaters". https://singulariki.com/industries/711110
Note: AI task overlap measures what today's AI can attempt, not automation, job loss, or a forecast.
AssetsShare imageMethodology & sourcesPress & newsroomThe newsroom
Every line is built only from figures this page already shows and cites. AI task overlap means what today's AI can attempt — not automation, job loss, or a forecast.
Sources for this page
Every figure above traces to a named public dataset and the exact release below — not hand-written opinion. See the full methodology for what each measure does and does not mean.
- O*NET 30.3 U.S. Department of Labor / National Center for O*NET Development
- BLS Occupational Employment and Wage Statistics (OEWS) May 2024 U.S. Bureau of Labor Statistics
- Census NAICS 2022 U.S. Census Bureau
- Anthropic Economic Index v4 (2026-01-15) + v2 (2025-03-27) Anthropic
- “GPTs are GPTs” (Eloundou et al.) arXiv 2303.10130 OpenAI / academic
- AI Occupational Exposure (AIOE) Felten, Raj & Seamans academic
Data compiled June 3, 2026. Figures are estimates, not advice.
Cite this page
Singulariki. "Theater Companies and Dinner Theaters." Singulariki: a source-backed encyclopedia of work. Built from O*NET 30.3; BLS Occupational Employment and Wage Statistics (OEWS) May 2024; Census NAICS 2022; Anthropic Economic Index v4 (2026-01-15) + v2 (2025-03-27); “GPTs are GPTs” (Eloundou et al.) arXiv 2303.10130; AI Occupational Exposure (AIOE) Felten, Raj & Seamans. Accessed June 7, 2026. https://singulariki.com/industries/711110
Singulariki. (2026). Theater Companies and Dinner Theaters. Singulariki: a source-backed encyclopedia of work. Retrieved June 7, 2026, from https://singulariki.com/industries/711110
@misc{singulariki-711110,
  title  = {Theater Companies and Dinner Theaters},
  author = {{Singulariki}},
  year   = {2026},
  note   = {O*NET 30.3; BLS Occupational Employment and Wage Statistics (OEWS) May 2024; Census NAICS 2022; Anthropic Economic Index v4 (2026-01-15) + v2 (2025-03-27); “GPTs are GPTs” (Eloundou et al.) arXiv 2303.10130; AI Occupational Exposure (AIOE) Felten, Raj & Seamans. Accessed June 7, 2026},
  url    = {https://singulariki.com/industries/711110}
} Citations name the underlying public dataset releases — they reflect what this page is built from, not just the URL.