Often handed to AI
Task areas most often handled directively in observed AI conversations — candidates to delegate with light review.
- Identify potential for loss and develop strategies to eliminate it. · 1.7%
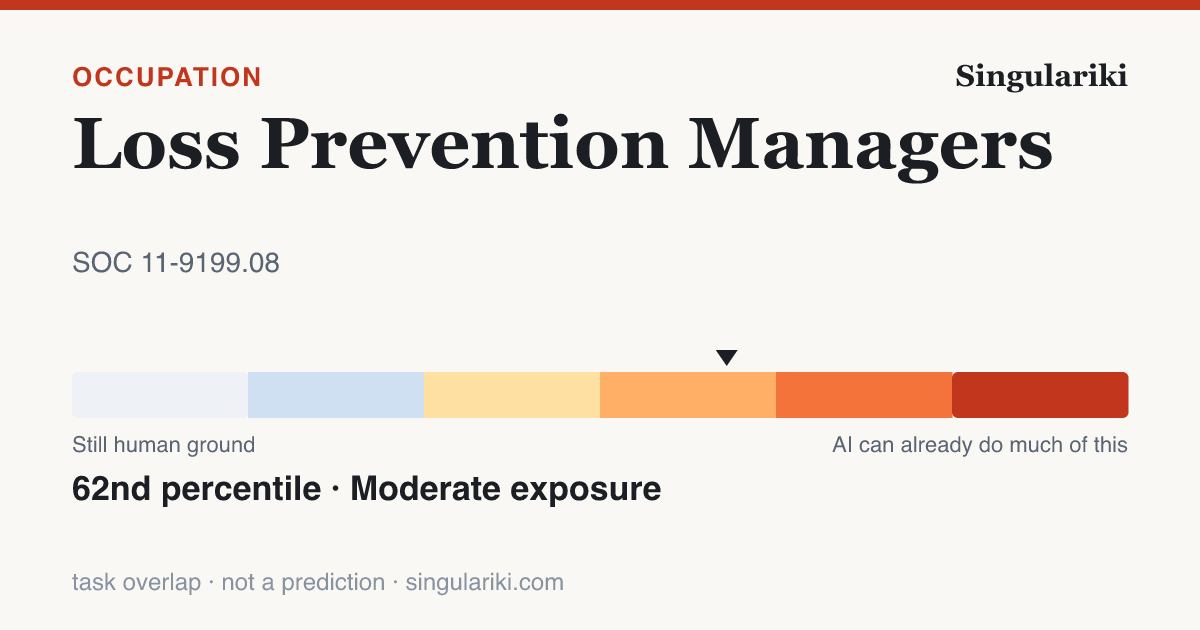
Occupation · SOC 11-9199.08
Plan and direct policies, procedures, or systems to prevent the loss of assets. Determine risk exposure or potential liability, and develop risk control measures.
Also called: Asset Protection Manager · Loss Prevention Director · Loss Prevention Manager · Loss Prevention Operations Manager · Logistics Loss Prevention Manager · Loss Control Manager · Loss Prevention Operations Director · Loss Prevention Supervisor · Market Asset Protection Manager · Area Asset Protection Manager · Area Loss Prevention Manager · Asset Protection Leader
Job family: Management Occupations
A source-stamped Markdown brief of this occupation — paste it into an agent, or fetch
/roles/role-11-9199-08/context.md directly.
A fast read on where AI already shows up in this occupation, where it stays a copilot, where humans remain in the loop, and what the labor market is doing. Built from observed Claude.ai conversations mapped to O*NET tasks and from published research — measures of usage and exposure, not advice or predictions that the job is going away.
Task areas most often handled directively in observed AI conversations — candidates to delegate with light review.
Task areas where a human was still judged necessary in a large share of observed conversations — not a safety ruling, an observed-need signal.
The capabilities O*NET rates most important for this occupation — the human ground the work is built on.
See all skills →Independent published positions, read together — not a forecast.
62nd-percentile task overlap — yet about 106,700 openings a year (+4.5% projected, BLS), and observed AI use leans 5621% copilot, not hand-off (AEI) . What exposure means →
What today's research says about this occupation's exposure to AI, how AI is actually being used in it, and where employment is headed. These are positions within published studies — measures of exposure and usage, not predictions that this job will disappear.
Each study uses its own scale, so the raw scores are not comparable across rows — the percentile (this job's rank among all U.S. occupations with data) is the comparable figure, and sizes the bars.
| Measure | Rank vs all occupations | Percentile | Score |
|---|---|---|---|
| Overall AI exposure (Felten et al.) High | 72nd | 1.0 | |
| LLM task exposure, γ (OpenAI / Eloundou) High | 67th | 0.8 | |
| AI assistant applicability (Microsoft) Moderate | 49th | 0.1 |
OpenAI's exposure study scores tasks three ways: with a language model alone (α 0.1), with simple added tooling (β 0.4), and including AI-powered software (γ 0.8). Higher means more of the job's tasks could be done at least twice as fast — not that they will be automated away.
Most of this job's tasks can be done remotely (Dingel–Neiman), which tends to track with higher digital and AI exposure.
A pre-LLM (2013) estimate of how automatable this job is by computerization and robotics. Shown for historical context only — it is not part of any current AI ranking.
Frey–Osborne probability 0.3 · 37th percentile among occupations · Moderate
Among measured AI assistant conversations mapped to this occupation (Anthropic Economic Index, 2026-01-15), these task types came up most. These are shares of observed AI conversations — not shares of the job, of worker time, or of what could be automated.
| Identify potential for loss and develop strategies to eliminate it. | 3.0% |
Independent U.S. Bureau of Labor Statistics employment projection for 2024–2034 — a labor-market forecast, not an AI-impact forecast.
| Outlook | About average · +4.5% by 2034 |
| Projected annual openings | 106,700 |
| Employment 2024 → 2034 | 1,333,700 → 1,393,500 |
“Annual openings” counts new jobs plus replacements for workers who leave the occupation, so it can be large even when growth is modest.
The ILO's 2025 global study scores generative-AI exposure on the international ISCO-08 occupation system, not US SOC. Bridged through the published (and approximate, many-to-many) IBS O*NET-SOC ↔ ISCO-08 crosswalk, this US occupation corresponds to the international 6 occupations below. Exposure here means how much of the work's tasks today's AI can attempt — task overlap, not automation, adoption, or jobs lost.
| International occupation (ISCO-08) | Task exposure (2025) | Most tasks fall in |
|---|---|---|
| Business Services and Administration Managers Not Elsewhere Classified · 1219 | 42% | Gradient 2 |
| Professional Services Managers Not Elsewhere Classified · 1349 | 38% | Minimal |
| Senior Officials of Special-interest Organizations · 1114 | 37% | Minimal |
| Policy and Planning Managers · 1213 | 36% | Not exposed |
| Mining Managers · 1322 | 35% | Minimal |
| Sports, Recreation and Cultural Centre Managers · 1431 | 32% | Minimal |
Read the whole six-band gradient on the GenAI exposure gradient page. The crosswalk is approximate: a US occupation can map to several international ones, and the ILO scores describe the international occupation, not this exact US role.
How people actually apply AI to this occupation's tasks, from Claude.ai (Free and Pro) conversations in the Anthropic Economic Index, 2026-01-15. This is one AI assistant's consumer sample — not all AI, not the whole workforce. Autonomy and the collaboration mix are model-rated estimates; figures below the sample floor are hidden.
| Augmentation vs. automation | 56.2% working with AI · 39.6% handed to AI |
| Most common way people use AI here | Directive · AI does it; you give the instruction |
| Typical AI autonomy | 4.0 / 5 · higher = AI acts more independently |
| Used for work (vs. personal / coursework) | 70.4% |
The role's most common tasks in AI conversations, each tagged with how people work with the AI on it. “Usage” is the share of observed conversations, not of the job.
| Task | How | Usage |
|---|---|---|
| Identify potential for loss and develop strategies to eliminate it. | Directive | 1.7% |
Tasks where the model most often judged that a person remained necessary — a useful read on the current boundary, not a guarantee.
| Identify potential for loss and develop strategies to eliminate it. | 92.3% |
Example prompts phrased from the tasks people most often delegate to AI in this occupation (Anthropic Economic Index). Each shows the underlying measured task and its share of observed AI use. They are suggested phrasings of real tasks — starting points, not endorsed instructions.
Help me identify potential for loss and develop strategies to eliminate it. From: Identify potential for loss and develop strategies to eliminate it. · 1.7% of measured AI use · directive
All 27 tasks O*NET lists for this occupation, ordered by importance. Each links to its own page with AI-exposure and observed-use detail.
O*NET importance rating, from 1 (not important) to 5 (extremely important).
| Oral Expression | 4.1 | |
| Problem Sensitivity | 4.1 | |
| Oral Comprehension | 4.0 | |
| Near Vision | 4.0 | |
| Written Comprehension | 3.9 | |
| Written Expression | 3.9 | |
| Deductive Reasoning | 3.9 | |
| Inductive Reasoning | 3.9 | |
| Speech Recognition | 3.8 | |
| Speech Clarity | 3.8 | |
| Originality | 3.4 |
| Reading Comprehension | 4.0 | |
| Active Listening | 4.0 | |
| Speaking | 4.0 | |
| Critical Thinking | 3.9 | |
| Monitoring | 3.9 | |
| Writing | 3.8 | |
| Active Learning | 3.8 | |
| Learning Strategies | 3.3 |
| Instructing | 3.9 | |
| Complex Problem Solving | 3.9 | |
| Judgment and Decision Making | 3.9 | |
| Time Management | 3.9 | |
| Persuasion | 3.8 | |
| Systems Analysis | 3.8 | |
| Systems Evaluation | 3.8 | |
| Social Perceptiveness | 3.6 | |
| Coordination | 3.6 | |
| Service Orientation | 3.6 | |
| Management of Personnel Resources | 3.6 | |
| Negotiation | 3.5 |
Skills employers ask for in job postings for this occupation (Lightcast), with whether each is a common or specialized skill.
Showing the top 40 of 43.
How characteristic each condition is of the job, on O*NET's 1–5 context scale (higher = more present in day-to-day work). Each condition links to how it varies across all occupations.
What to study: Business, Management, Marketing, and Related Support Services , Communication, Journalism, and Related Programs , Computer and Information Sciences and Support Services , Health Professions and Related Programs , History , Homeland Security, Law Enforcement, Firefighting and Related Protective Services , Library Science , Multi/Interdisciplinary Studies , Natural Resources and Conservation , Psychology , Public Administration and Social Service Professions , Social Sciences , Theology and Religious Vocations , Visual and Performing Arts . Fields of study crosswalked to this occupation (NCES CIP–SOC), not a requirement.
Share of people in this occupation at each level of education.
| Bachelor's Degree | 54.5% | |
| High School Diploma | 13.6% | |
| Post-Secondary Certificate | 9.1% | |
| Some College Courses | 9.1% | |
| Associate's Degree (or other 2-year degree) | 9.1% | |
| Post-Baccalaureate Certificate | 4.5% |
The interests and personal qualities O*NET associates with people who do this work.
| Dependability | 9.0 | |
| Attention to Detail | 8.0 | |
| Integrity | 7.0 | |
| Cautiousness | 6.0 | |
| Achievement Orientation | 5.0 | |
| Self-Control | 4.0 | |
| Stress Tolerance | 3.0 |
| Management/Administration | 6.0 | |
| Protective Service | 4.7 | |
| Law | 3.1 | |
| Accounting | 2.8 |
| Conventional | 5.8 | |
| Enterprising | 5.6 | |
| Investigative | 3.6 | |
| Realistic | 3.4 | |
| Social | 2.9 |
U.S. · annual wages (BLS OEWS)
| 10th percentile | $68,860 |
| 25th percentile | $100,010 |
| Median (50th) | $136,550 |
| 75th percentile | $179,190 |
| 90th percentile | $227,590 |
| People employed | 630,980 |
Wages and employment are reported by BLS for the broader occupation group this specialty belongs to (SOC 11-9199), not for the specialty alone.
Where these workers are employed, by number of jobs (national, BLS OEWS). Pay shown is the occupation's national median, not industry-specific.
| Industry | Workers | National median pay |
|---|---|---|
| Professional, Scientific, and Technical Services · Sector | 94,490 | $164,060 |
| Management of Companies and Enterprises · Sector | 50,980 | $163,830 |
| Manufacturing · Sector | 46,390 | $160,640 |
| Finance and Insurance · Sector | 44,890 | $162,780 |
| Information · Sector | 38,680 | $167,740 |
| Educational Services · Sector | 32,840 | $102,450 |
| Administrative and Support and Waste Management and Remediation Services · Sector | 32,500 | $109,990 |
| Health Care and Social Assistance · Sector | 31,360 | $108,810 |
| Wholesale Trade · Sector | 25,860 | $137,780 |
| Construction · Sector | 19,840 | $110,040 |
| Other Services (except Public Administration) · Sector | 19,110 | $111,320 |
| Retail Trade · Sector | 13,510 | $95,720 |
Industries where this occupation is far more common than in the economy as a whole. The location quotient is how many times more concentrated it is here (a value of 5 means five times its economy-wide share).
| Industry | Concentration | Workers |
|---|---|---|
| Wind Electric Power Generation · National industry | 9.11× | 370 |
| Research and Development in the Social Sciences and Humanities · National industry | 6.07× | 1,510 |
| Management of Companies and Enterprises · Sector | 4.43× | 50,980 |
| Direct Health and Medical Insurance Carriers · National industry | 3.92× | 7,200 |
| Solar Electric Power Generation · National industry | 3.33× | 190 |
| Information · Sector | 3.25× | 38,680 |
| Nuclear Electric Power Generation · National industry | 2.7× | 410 |
| Labor Unions and Similar Labor Organizations · National industry | 2.65× | 1,150 |
Part of the Arts, Entertainment, & Design , Management & Entrepreneurship and Public Service & Safety career clusters.
Side-by-side comparisons place two occupations’ pay, preparation, skills, and AI exposure on the same page — same data, same scale, no forecast.
Options the data surfaces for Loss Prevention Managers — not advice or a forecast. Each is a real cross-link you can follow into the evidence.
Capabilities this work builds that are used across many other occupations.
Occupations O*NET rates as related — the nearby moves on the map.
How people typically prepare for this work.
On the global GenAI exposure gradient this work sits around the 68th percentile of 427 international occupations.
Loss Prevention Managers show 62nd-percentile AI task overlap — and about 106,700 annual U.S. openings
Loss Prevention Managers show 62nd-percentile AI task overlap — and about 106,700 annual U.S. openings

• Loss Prevention Managers rank in the 62nd percentile (Moderate band) for AI task overlap across U.S. occupations — a measure of how much of the work today's AI can attempt, not how much is automated. (Eloundou et al. (GPTs are GPTs) + Felten AIOE)
• The occupation is projected to see about 106,700 U.S. job openings per year (2024–34), counting growth and replacement — a labor-demand projection made independently of AI. (BLS Employment Projections 2024–34)
• BLS projects employment to be about average (+4.5%) from 2024 to 2034. (BLS Employment Projections 2024–34)
• Median annual pay is $136,550, across about 630,980 U.S. workers. (BLS OEWS (May 2024))
• Of the AI use actually observed for this work, 56% looks like augmentation (drafting, iterating, checking) rather than hands-off automation — from a Claude.ai usage sample, not a census. (2026-01-15-v4-plus-2025-03-27-v2)

Source: Singulariki — "Loss Prevention Managers". https://singulariki.com/roles/role-11-9199-08
Note: AI task overlap measures what today's AI can attempt, not automation, job loss, or a forecast.
AssetsShare imageMethodology & sourcesPress & newsroomThe newsroom
Every line is built only from figures this page already shows and cites. AI task overlap means what today's AI can attempt — not automation, job loss, or a forecast.
Every figure above traces to a named public dataset and the exact release below — not hand-written opinion. See the full methodology for what each measure does and does not mean.
Data compiled June 2, 2026. Figures are estimates, not advice.
Singulariki. "Loss Prevention Managers." Singulariki: a source-backed encyclopedia of work. Built from O*NET 30.3; BLS Occupational Employment and Wage Statistics (OEWS) May 2024; BLS Employment Projections 2024–2034; Anthropic Economic Index v4 (2026-01-15) + v2 (2025-03-27); Microsoft “Working with AI” working-with-ai; “GPTs are GPTs” (Eloundou et al.) arXiv 2303.10130; AI Occupational Exposure (AIOE) Felten, Raj & Seamans; ILO / Gmyrek et al. GenAI exposure gradient 2025; IBS O*NET-SOC ↔ ISCO-08 occupation crosswalk 2022; Frey & Osborne (2013) frey-osborne-automation; Dingel & Neiman (2020) dingel-neiman-workathome. Accessed June 7, 2026. https://singulariki.com/roles/role-11-9199-08
Singulariki. (2026). Loss Prevention Managers. Singulariki: a source-backed encyclopedia of work. Retrieved June 7, 2026, from https://singulariki.com/roles/role-11-9199-08
@misc{singulariki-role-11-9199-08,
  title  = {Loss Prevention Managers},
  author = {{Singulariki}},
  year   = {2026},
  note   = {O*NET 30.3; BLS Occupational Employment and Wage Statistics (OEWS) May 2024; BLS Employment Projections 2024–2034; Anthropic Economic Index v4 (2026-01-15) + v2 (2025-03-27); Microsoft “Working with AI” working-with-ai; “GPTs are GPTs” (Eloundou et al.) arXiv 2303.10130; AI Occupational Exposure (AIOE) Felten, Raj & Seamans; ILO / Gmyrek et al. GenAI exposure gradient 2025; IBS O*NET-SOC ↔ ISCO-08 occupation crosswalk 2022; Frey & Osborne (2013) frey-osborne-automation; Dingel & Neiman (2020) dingel-neiman-workathome. Accessed June 7, 2026},
  url    = {https://singulariki.com/roles/role-11-9199-08}
} Citations name the underlying public dataset releases — they reflect what this page is built from, not just the URL.