Casino Hotels
National industry · NAICS 721120
A source-stamped Markdown brief of this occupation — paste it into an agent, or fetch
/industries/721120/context.md directly.
Casino Hotels is a U.S. industry in the NAICS classification. The Bureau of Labor Statistics estimates about 337,000 workers across 177 detailed occupations in it. A typical worker earns around $43,184 a year (Singulariki estimate, see below).
This industry comprises establishments primarily engaged in providing short-term lodging in hotel facilities with a casino on the premises. The casino on premises includes table wagering games and may include other gambling activities, such as slot machines and sports betting. These establishments generally offer a range of services and amenities, such as food and beverage services, entertainment, valet parking, swimming pools, and conference and convention facilities. Included in this industry are casino hotels with racetracks. Cross-References. Establishments primarily engaged in--
Employment is national May 2024 OEWS. "Typical pay" is Singulariki's own figure — the employment-weighted average of each occupation's national median wage — a rough center of the industry, not an official BLS number.
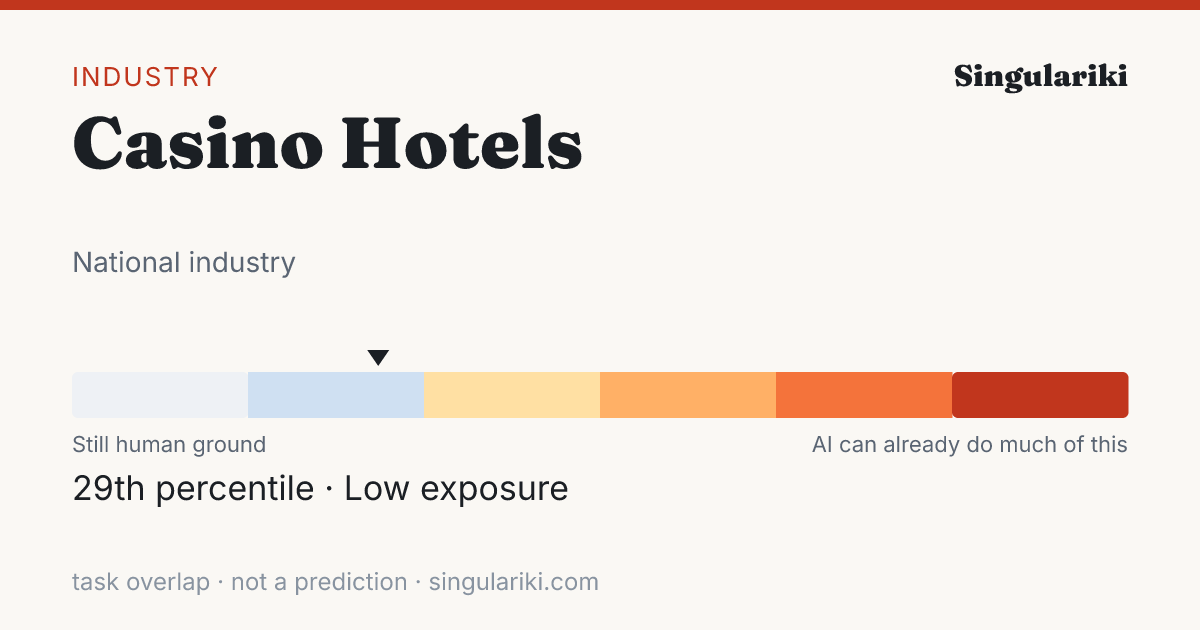
How exposed this industry is to AI
Weighting every occupation in this industry by its employment and its unified AI-exposure index (the OpenAI "GPTs are GPTs" human-rated task overlap folded with the Felten/Raj/Seamans AIOE index), this industry sits in the Low band — 29th percentile across all industries.
Exposure measures how much of the work overlaps with what today's AI can do, not a prediction of automation; high-exposure industries are where AI is most likely to reshape tasks. Employment-weighted across 160 occupations that carry an exposure score. Compare every industry on the AI exposure hub.
How AI is actually used in this industry
Among measured Claude.ai (Free and Pro) conversations mapped to O*NET task statements (Anthropic Economic Index, 2026-01-15), these patterns are most associated with the occupations in this industry, weighted by its employment mix. They are shares of observed AI conversations — not of worker time, revenue, or what could be automated — and reflect one AI assistant's consumer sample, not all AI.
| Signal coverage | 65.3% of employment · 98/176 occupations have AEI task data |
| Augmentation vs. automation | 32.1% working with AI · 30.1% handed to AI |
| Most common pattern | Directive · AI does it; you give the instruction |
| Typical AI autonomy | 3.6 / 5 · higher = AI acts more independently |
Tasks driving the signal
The task families that account for the most AI activity across this industry's occupations (employment × observed usage), each attributed to the occupation it comes from.
| Task | Occupation | How | Share of signal |
|---|---|---|---|
| Answer customers' questions, and provide information on procedures or policies. | Cashiers | Directive | 15.7% |
| Troubleshoot problems involving office equipment, such as computer hardware and software. | Office Clerks, General | Feedback loop | 6.9% |
| Participate in the work of subordinates to facilitate productivity or to overcome difficult aspects of work. | First-Line Supervisors of Office and Administrative Support Workers | Iteration | 6.7% |
| Plan parties or other special events and services. | Hosts and Hostesses, Restaurant, Lounge, and Coffee Shop | Iteration | 5.2% |
| Plan and price menu items. | Cooks, Restaurant | Directive | 3.7% |
| Describe and recommend wines to customers. | Waiters and Waitresses | Directive | 2.9% |
| Assist customers by providing information and resolving their complaints. | Cashiers | Iteration | 2.1% |
| Weigh, measure, and mix ingredients according to recipes or personal judgment, using various kitchen utensils and equipment. | Cooks, Restaurant | Directive | 2.0% |
| Use computers for various applications, such as database management or word processing. | Secretaries and Administrative Assistants, Except Legal, Medical, and Executive | Directive | 1.8% |
| Conduct searches to find needed information, using such sources as the Internet. | Secretaries and Administrative Assistants, Except Legal, Medical, and Executive | Directive | 1.7% |
| Recommend, select, and help locate or obtain merchandise based on customer needs and desires. | Retail Salespersons | Iteration | 1.5% |
| Greet customers and ascertain what each customer wants or needs. | Retail Salespersons | none | 1.5% |
Occupations behind the signal
The occupations whose AI-touched tasks contribute most to this industry's signal, by employment here.
| Occupation | Workers | Share | How they use AI |
|---|---|---|---|
| Gambling Dealers | 45,110 | 13.4% | — |
| Waiters and Waitresses | 26,770 | 7.9% | Directive |
| Maids and Housekeeping Cleaners | 24,030 | 7.1% | Directive |
| Cooks, Restaurant | 15,900 | 4.7% | Directive |
| Bartenders | 12,690 | 3.8% | Directive |
| Maintenance and Repair Workers, General | 6,330 | 1.9% | Learning |
| Hotel, Motel, and Resort Desk Clerks | 6,060 | 1.8% | Directive |
| Gambling Cage Workers | 5,480 | 1.6% | Directive |
| First-Line Supervisors of Office and Administrative Support Workers | 4,680 | 1.4% | Iteration |
| First-Line Supervisors of Food Preparation and Serving Workers | 4,320 | 1.3% | Directive |
| Hosts and Hostesses, Restaurant, Lounge, and Coffee Shop | 3,930 | 1.2% | Iteration |
| First-Line Supervisors of Housekeeping and Janitorial Workers | 3,870 | 1.1% | Directive |
This rollup is only as complete as the occupation-task matches available for the industry; the coverage figure above is shown so sparse industries do not look falsely precise. AI exposure is not the same as replacement.
Skill & tool metabolism
What this industry's work actually runs on. Each figure is the share of the industry's workers in occupations that significantly rely on a skill, knowledge area, or ability (O*NET importance ≥ 3 of 5), or that use a tool category — its employment reach. This is a measure of how widespread a requirement is across the workforce, not how intensively any one worker uses it. Shares are independent and need not add to 100%.
Based on 96.4% of this industry's employment that maps to a detailed occupation with an O*NET skill profile.
Skills
| Skill | Employment reach | Workers |
|---|---|---|
| Active Listening | 81.4% | 274,150 |
| Speaking | 80.7% | 271,960 |
| Service Orientation | 69.8% | 235,220 |
| Monitoring | 65.2% | 219,680 |
| Social Perceptiveness | 64.1% | 216,040 |
| Coordination | 55.9% | 188,480 |
| Reading Comprehension | 53.9% | 181,480 |
| Time Management | 44.6% | 150,450 |
| Critical Thinking | 42.3% | 142,410 |
| Judgment and Decision Making | 29.5% | 99,340 |
| Complex Problem Solving | 28.9% | 97,490 |
| Active Learning | 25.3% | 85,420 |
Knowledge areas
| Knowledge area | Employment reach | Workers |
|---|---|---|
| English Language | 84.7% | 285,600 |
| Customer and Personal Service | 80.8% | 272,390 |
| Mathematics | 36.8% | 124,140 |
| Administration and Management | 36.6% | 123,230 |
| Public Safety and Security | 34.1% | 114,850 |
| Administrative | 27.5% | 92,780 |
| Sales and Marketing | 25.5% | 85,770 |
| Computers and Electronics | 23.8% | 80,270 |
| Education and Training | 23.8% | 80,060 |
| Personnel and Human Resources | 14.9% | 50,050 |
| Food Production | 12.4% | 41,780 |
| Psychology | 12.2% | 41,070 |
Abilities
| Abilitie | Employment reach | Workers |
|---|---|---|
| Near Vision | 96.2% | 324,200 |
| Oral Comprehension | 94.1% | 317,200 |
| Oral Expression | 93.1% | 313,780 |
| Problem Sensitivity | 80.1% | 269,920 |
| Speech Recognition | 78.1% | 263,210 |
| Speech Clarity | 77.5% | 261,050 |
| Information Ordering | 73.7% | 248,220 |
| Deductive Reasoning | 65.2% | 219,670 |
| Selective Attention | 52.4% | 176,510 |
| Manual Dexterity | 51.5% | 173,690 |
| Written Comprehension | 44.6% | 150,400 |
| Trunk Strength | 43.3% | 145,800 |
Tool categories
| Tool category | Employment reach | Workers |
|---|---|---|
| Spreadsheet software | 83.1% | 280,080 |
| Electronic mail software | 75.6% | 254,830 |
| Office suite software | 69.4% | 233,800 |
| Word processing software | 56.0% | 188,780 |
| Web page creation and editing software | 47.1% | 158,690 |
| Data base user interface and query software | 42.8% | 144,130 |
| Operating system software | 31.8% | 107,070 |
| Presentation software | 31.3% | 105,450 |
| Cloud-based data access and sharing software | 29.4% | 99,160 |
| Point of sale POS software | 29.4% | 98,910 |
| Instant messaging software | 25.1% | 84,450 |
| Internet browser software | 23.1% | 77,750 |
| Business intelligence and data analysis software | 20.9% | 70,350 |
| Desktop communications software | 20.2% | 67,940 |
| Enterprise resource planning ERP software | 19.4% | 65,280 |
Reach = share of industry employment in occupations where the requirement is significant; it is not a per-worker usage or proficiency measure. Skill, knowledge, and ability importance is from O*NET; tool use is reported presence of a technology category.
Largest occupations
The occupations that employ the most people in this industry, with their share of the industry's workforce and national median pay for the occupation (not industry-specific pay).
Showing the top 40 of 177 occupations by employment.
Most distinctive occupations
The occupations most unusually concentrated in this industry compared with the economy as a whole. The location quotient is how many times more common an occupation is here versus its economy-wide share (a value of 5 means five times as concentrated).
Write a report on thisheadline · factoids · citation
The Casino Hotels workforce sits at the 29th percentile of AI task overlap — 337,000 U.S. workers
- Weighting every occupation by its real share of Casino Hotels employment, the industry's workforce ranks in the 29th percentile (Low band) for AI task overlap — overlap with what AI can attempt, not a measure of jobs at risk.Eloundou et al. + Felten AIOE, weighted by BLS OEWS
- The industry employs about 337,000 U.S. workers across 177 occupations.BLS OEWS (May 2024)
- Employment-weighted typical annual pay is about $43,184.BLS OEWS (May 2024)
- Of AI use observed across this industry's occupations, 32% looks like augmentation rather than automation — from a Claude.ai sample, not a census.Anthropic Economic Index
The Casino Hotels workforce sits at the 29th percentile of AI task overlap — 337,000 U.S. workers

• Weighting every occupation by its real share of Casino Hotels employment, the industry's workforce ranks in the 29th percentile (Low band) for AI task overlap — overlap with what AI can attempt, not a measure of jobs at risk. (Eloundou et al. + Felten AIOE, weighted by BLS OEWS)
• The industry employs about 337,000 U.S. workers across 177 occupations. (BLS OEWS (May 2024))
• Employment-weighted typical annual pay is about $43,184. (BLS OEWS (May 2024))
• Of AI use observed across this industry's occupations, 32% looks like augmentation rather than automation — from a Claude.ai sample, not a census. (Anthropic Economic Index)

Source: Singulariki — "Casino Hotels". https://singulariki.com/industries/721120
Note: AI task overlap measures what today's AI can attempt, not automation, job loss, or a forecast.
AssetsShare imageMethodology & sourcesPress & newsroomThe newsroom
Every line is built only from figures this page already shows and cites. AI task overlap means what today's AI can attempt — not automation, job loss, or a forecast.
Sources for this page
Every figure above traces to a named public dataset and the exact release below — not hand-written opinion. See the full methodology for what each measure does and does not mean.
- O*NET 30.3 U.S. Department of Labor / National Center for O*NET Development
- BLS Occupational Employment and Wage Statistics (OEWS) May 2024 U.S. Bureau of Labor Statistics
- Census NAICS 2022 U.S. Census Bureau
- Anthropic Economic Index v4 (2026-01-15) + v2 (2025-03-27) Anthropic
- “GPTs are GPTs” (Eloundou et al.) arXiv 2303.10130 OpenAI / academic
- AI Occupational Exposure (AIOE) Felten, Raj & Seamans academic
Data compiled June 3, 2026. Figures are estimates, not advice.
Cite this page
Singulariki. "Casino Hotels." Singulariki: a source-backed encyclopedia of work. Built from O*NET 30.3; BLS Occupational Employment and Wage Statistics (OEWS) May 2024; Census NAICS 2022; Anthropic Economic Index v4 (2026-01-15) + v2 (2025-03-27); “GPTs are GPTs” (Eloundou et al.) arXiv 2303.10130; AI Occupational Exposure (AIOE) Felten, Raj & Seamans. Accessed June 7, 2026. https://singulariki.com/industries/721120
Singulariki. (2026). Casino Hotels. Singulariki: a source-backed encyclopedia of work. Retrieved June 7, 2026, from https://singulariki.com/industries/721120
@misc{singulariki-721120,
  title  = {Casino Hotels},
  author = {{Singulariki}},
  year   = {2026},
  note   = {O*NET 30.3; BLS Occupational Employment and Wage Statistics (OEWS) May 2024; Census NAICS 2022; Anthropic Economic Index v4 (2026-01-15) + v2 (2025-03-27); “GPTs are GPTs” (Eloundou et al.) arXiv 2303.10130; AI Occupational Exposure (AIOE) Felten, Raj & Seamans. Accessed June 7, 2026},
  url    = {https://singulariki.com/industries/721120}
} Citations name the underlying public dataset releases — they reflect what this page is built from, not just the URL.