Skills it runs on
The capabilities O*NET rates most important for this occupation — the human ground the work is built on.
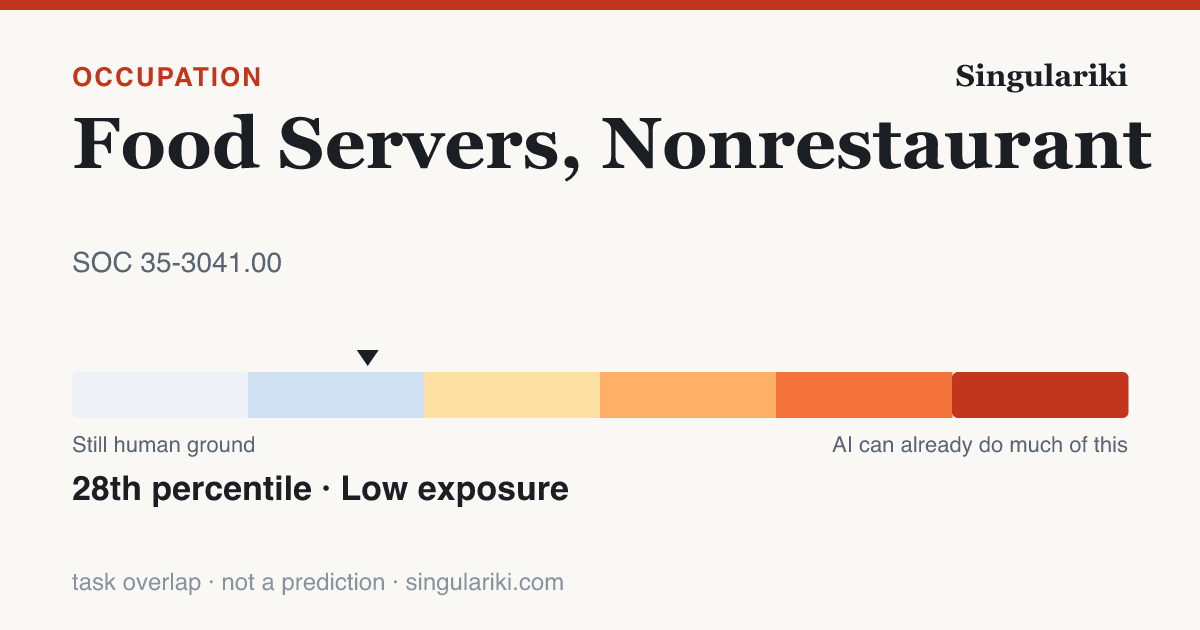
See all skills →Occupation · SOC 35-3041.00
Serve food to individuals outside of a restaurant environment, such as in hotel rooms, hospital rooms, residential care facilities, or cars.
Also called: Food Service Worker · Room Server · Room Service Server · Tray Server · Food Server · Kitchen Runner · Boat Hop · Car Attendant · Car Hop · Curb Attendant · Curb Hop · Curber
Job family: Food Preparation and Serving Related Occupations
A source-stamped Markdown brief of this occupation — paste it into an agent, or fetch
/roles/role-35-3041-00/context.md directly.
A fast read on where AI already shows up in this occupation, where it stays a copilot, where humans remain in the loop, and what the labor market is doing. Built from observed Claude.ai conversations mapped to O*NET tasks and from published research — measures of usage and exposure, not advice or predictions that the job is going away.
The capabilities O*NET rates most important for this occupation — the human ground the work is built on.
See all skills →Independent published positions, read together — not a forecast.
28th-percentile task overlap — yet about 48,000 openings a year (+3% projected, BLS) . What exposure means →
What today's research says about this occupation's exposure to AI, how AI is actually being used in it, and where employment is headed. These are positions within published studies — measures of exposure and usage, not predictions that this job will disappear.
Each study uses its own scale, so the raw scores are not comparable across rows — the percentile (this job's rank among all U.S. occupations with data) is the comparable figure, and sizes the bars.
| Measure | Rank vs all occupations | Percentile | Score |
|---|---|---|---|
| Overall AI exposure (Felten et al.) Low | 28th | -0.7 | |
| LLM task exposure, γ (OpenAI / Eloundou) Low | 23rd | 0.2 | |
| AI assistant applicability (Microsoft) Moderate | 37th | 0.1 |
OpenAI's exposure study scores tasks three ways: with a language model alone (α 0.1), with simple added tooling (β 0.1), and including AI-powered software (γ 0.2). Higher means more of the job's tasks could be done at least twice as fast — not that they will be automated away.
This job mostly cannot be done remotely (Dingel–Neiman) — its hands-on tasks sit outside what software-based AI reaches.
Mixed signals. Today's AI/LLM studies show relatively low exposure for this job, but the older (2013) Frey–Osborne work rated it higher for computerization and robotics. Different eras, different technologies — the AI measures above reflect the current state.
A pre-LLM (2013) estimate of how automatable this job is by computerization and robotics. Shown for historical context only — it is not part of any current AI ranking.
Frey–Osborne probability 0.9 · 72nd percentile among occupations · High
Among measured AI assistant conversations mapped to this occupation (Anthropic Economic Index, 2026-01-15), these task types came up most. These are shares of observed AI conversations — not shares of the job, of worker time, or of what could be automated.
| Take food orders and relay orders to kitchens or serving counters so they can be filled. | 0.7% |
Independent U.S. Bureau of Labor Statistics employment projection for 2024–2034 — a labor-market forecast, not an AI-impact forecast.
| Outlook | About average · +3.0% by 2034 |
| Projected annual openings | 48,000 |
| Employment 2024 → 2034 | 277,200 → 285,300 |
“Annual openings” counts new jobs plus replacements for workers who leave the occupation, so it can be large even when growth is modest.
The ILO's 2025 global study scores generative-AI exposure on the international ISCO-08 occupation system, not US SOC. Bridged through the published (and approximate, many-to-many) IBS O*NET-SOC ↔ ISCO-08 crosswalk, this US occupation corresponds to the international 2 occupations below. Exposure here means how much of the work's tasks today's AI can attempt — task overlap, not automation, adoption, or jobs lost.
| International occupation (ISCO-08) | Task exposure (2025) | Most tasks fall in |
|---|---|---|
| Waiters · 5131 | 28% | Minimal |
| Street Food Salespersons · 5212 | 22% | Not exposed |
Read the whole six-band gradient on the GenAI exposure gradient page. The crosswalk is approximate: a US occupation can map to several international ones, and the ILO scores describe the international occupation, not this exact US role.
All 14 tasks O*NET lists for this occupation, ordered by importance. Each links to its own page with AI-exposure and observed-use detail.
O*NET importance rating, from 1 (not important) to 5 (extremely important).
| Oral Comprehension | 3.5 | |
| Oral Expression | 3.1 | |
| Near Vision | 3.1 | |
| Selective Attention | 3.0 | |
| Speech Recognition | 3.0 | |
| Speech Clarity | 3.0 | |
| Problem Sensitivity | 2.9 | |
| Deductive Reasoning | 2.9 | |
| Inductive Reasoning | 2.9 | |
| Information Ordering | 2.9 | |
| Arm-Hand Steadiness | 2.9 | |
| Manual Dexterity | 2.9 | |
| Trunk Strength | 2.9 | |
| Written Comprehension | 2.8 | |
| Far Vision | 2.6 | |
| Written Expression | 2.5 | |
| Static Strength | 2.4 | |
| Extent Flexibility | 2.4 | |
| Gross Body Coordination | 2.4 | |
| Gross Body Equilibrium | 2.4 |
| Active Listening | 3.0 | |
| Speaking | 3.0 | |
| Reading Comprehension | 2.9 | |
| Critical Thinking | 2.9 | |
| Monitoring | 2.8 |
| Service Orientation | 3.0 | |
| Social Perceptiveness | 2.9 | |
| Coordination | 2.9 | |
| Time Management | 2.9 | |
| Judgment and Decision Making | 2.8 |
Skills employers ask for in job postings for this occupation (Lightcast), with whether each is a common or specialized skill.
| Example | Category | |
|---|---|---|
| Web page creation and editing software | Hot technology | |
| Microsoft Office software | Office suite software | Hot technology |
| Microsoft Outlook | Electronic mail software | Hot technology |
| Microsoft Windows | Operating system software | Hot technology |
| Capital Codeworks MenuMax | Enterprise resource planning ERP software | |
| CBORD Nutrition Service Suite | Data base user interface and query software | |
| Picis CareSuite | Data base user interface and query software |
How characteristic each condition is of the job, on O*NET's 1–5 context scale (higher = more present in day-to-day work). Each condition links to how it varies across all occupations.
Share of people in this occupation at each level of education.
| High School Diploma | 48.1% | |
| Less than a High School Diploma | 27.1% | |
| Some College Courses | 8.6% | |
| Post-Doctoral Training | 6.6% | |
| Bachelor's Degree | 6.2% | |
| Associate's Degree (or other 2-year degree) | 2.0% | |
| Post-Secondary Certificate | 1.4% |
The interests and personal qualities O*NET associates with people who do this work.
| Personal Service | 5.0 | |
| Physical/Manual Labor | 3.6 | |
| Health Care Service | 2.7 | |
| Culinary Art | 2.6 | |
| Social Service | 2.4 | |
| Sales | 1.8 | |
| Human Resources | 1.6 |
| Realistic | 4.8 | |
| Social | 4.2 | |
| Conventional | 3.9 | |
| Enterprising | 2.9 | |
| Artistic | 2.1 |
| Dependability | 3.0 | |
| Cooperation | 2.0 | |
| Attention to Detail | 2.0 | |
| Social Orientation | 1.6 |
U.S. · annual wages (BLS OEWS)
| 10th percentile | $26,590 |
| 25th percentile | $29,800 |
| Median (50th) | $34,460 |
| 75th percentile | $37,550 |
| 90th percentile | $44,770 |
| People employed | 271,780 |
Where these workers are employed, by number of jobs (national, BLS OEWS). Pay shown is the occupation's national median, not industry-specific.
| Industry | Workers | National median pay |
|---|---|---|
| Health Care and Social Assistance · Sector | 175,940 | $34,680 |
| Accommodation and Food Services · Sector | 60,730 | $33,920 |
| Administrative and Support and Waste Management and Remediation Services · Sector | 10,260 | $33,800 |
| Arts, Entertainment, and Recreation · Sector | 8,250 | $31,470 |
| Temporary Help Services · National industry | 6,290 | $35,330 |
| Information · Sector | 3,420 | $33,920 |
| Educational Services · Sector | 2,970 | $34,930 |
| Full-Service Restaurants · National industry | 2,330 | $31,950 |
| Other Services (except Public Administration) · Sector | 1,790 | $37,990 |
| Retail Trade · Sector | 1,410 | $34,360 |
| Casino Hotels · National industry | 1,090 | $34,450 |
| Services for the Elderly and Persons with Disabilities · National industry | 1,030 | $33,340 |
Industries where this occupation is far more common than in the economy as a whole. The location quotient is how many times more concentrated it is here (a value of 5 means five times its economy-wide share).
| Industry | Concentration | Workers |
|---|---|---|
| Health Care and Social Assistance · Sector | 4.32× | 175,940 |
| Accommodation and Food Services · Sector | 2.42× | 60,730 |
| Casino Hotels · National industry | 1.83× | 1,090 |
| Arts, Entertainment, and Recreation · Sector | 1.77× | 8,250 |
| Temporary Help Services · National industry | 1.35× | 6,290 |
| Residential Mental Health and Substance Abuse Facilities · National industry | 0.92× | 420 |
| Information · Sector | 0.67× | 3,420 |
| Administrative and Support and Waste Management and Remediation Services · Sector | 0.64× | 10,260 |
Part of the Healthcare & Human Services career cluster.
Side-by-side comparisons place two occupations’ pay, preparation, skills, and AI exposure on the same page — same data, same scale, no forecast.
Options the data surfaces for Food Servers, Nonrestaurant — not advice or a forecast. Each is a real cross-link you can follow into the evidence.
Capabilities this work builds that are used across many other occupations.
Occupations O*NET rates as related — the nearby moves on the map.
How people typically prepare for this work.
On the global GenAI exposure gradient this work sits around the 47th percentile of 427 international occupations.
Food Servers, Nonrestaurant show 28th-percentile AI task overlap — and about 48,000 annual U.S. openings
Food Servers, Nonrestaurant show 28th-percentile AI task overlap — and about 48,000 annual U.S. openings

• Food Servers, Nonrestaurant rank in the 28th percentile (Low band) for AI task overlap across U.S. occupations — a measure of how much of the work today's AI can attempt, not how much is automated. (Eloundou et al. (GPTs are GPTs) + Felten AIOE)
• The occupation is projected to see about 48,000 U.S. job openings per year (2024–34), counting growth and replacement — a labor-demand projection made independently of AI. (BLS Employment Projections 2024–34)
• BLS projects employment to be about average (+3%) from 2024 to 2034. (BLS Employment Projections 2024–34)
• Median annual pay is $34,460, across about 271,780 U.S. workers. (BLS OEWS (May 2024))

Source: Singulariki — "Food Servers, Nonrestaurant". https://singulariki.com/roles/role-35-3041-00
Note: AI task overlap measures what today's AI can attempt, not automation, job loss, or a forecast.
AssetsShare imageMethodology & sourcesPress & newsroomThe newsroom
Every line is built only from figures this page already shows and cites. AI task overlap means what today's AI can attempt — not automation, job loss, or a forecast.
Every figure above traces to a named public dataset and the exact release below — not hand-written opinion. See the full methodology for what each measure does and does not mean.
Data compiled June 2, 2026. Figures are estimates, not advice.
Singulariki. "Food Servers, Nonrestaurant." Singulariki: a source-backed encyclopedia of work. Built from O*NET 30.3; BLS Occupational Employment and Wage Statistics (OEWS) May 2024; BLS Employment Projections 2024–2034; Anthropic Economic Index v4 (2026-01-15) + v2 (2025-03-27); Microsoft “Working with AI” working-with-ai; “GPTs are GPTs” (Eloundou et al.) arXiv 2303.10130; AI Occupational Exposure (AIOE) Felten, Raj & Seamans; ILO / Gmyrek et al. GenAI exposure gradient 2025; IBS O*NET-SOC ↔ ISCO-08 occupation crosswalk 2022; Frey & Osborne (2013) frey-osborne-automation; Dingel & Neiman (2020) dingel-neiman-workathome. Accessed June 7, 2026. https://singulariki.com/roles/role-35-3041-00
Singulariki. (2026). Food Servers, Nonrestaurant. Singulariki: a source-backed encyclopedia of work. Retrieved June 7, 2026, from https://singulariki.com/roles/role-35-3041-00
@misc{singulariki-role-35-3041-00,
  title  = {Food Servers, Nonrestaurant},
  author = {{Singulariki}},
  year   = {2026},
  note   = {O*NET 30.3; BLS Occupational Employment and Wage Statistics (OEWS) May 2024; BLS Employment Projections 2024–2034; Anthropic Economic Index v4 (2026-01-15) + v2 (2025-03-27); Microsoft “Working with AI” working-with-ai; “GPTs are GPTs” (Eloundou et al.) arXiv 2303.10130; AI Occupational Exposure (AIOE) Felten, Raj & Seamans; ILO / Gmyrek et al. GenAI exposure gradient 2025; IBS O*NET-SOC ↔ ISCO-08 occupation crosswalk 2022; Frey & Osborne (2013) frey-osborne-automation; Dingel & Neiman (2020) dingel-neiman-workathome. Accessed June 7, 2026},
  url    = {https://singulariki.com/roles/role-35-3041-00}
} Citations name the underlying public dataset releases — they reflect what this page is built from, not just the URL.