A source-stamped Markdown brief of this occupation — paste it into an agent, or fetch
/roles/role-41-9011-00/context.md directly.
AI work map
A fast read on where AI already shows up in this occupation, where it stays a copilot,
where humans remain in the loop, and what the labor market is doing. Built from observed
Claude.ai conversations mapped to O*NET tasks and from published research — measures of
usage and exposure, not advice or predictions that the job is going away.
Often handed to AI
Task areas most often handled directively in observed AI conversations —
candidates to delegate with light review.
Suggest specific product purchases to meet customers' needs. · 2.8%
Provide product information, using lectures, films, charts, or slide shows. · 0.9%
↔54th-percentile task overlap — yet
about 14,000 openings a year
(-0.1% projected, BLS), and
observed AI use leans 4817% copilot, not hand-off (AEI)
. What exposure means →
AI & job outlook
What today's research says about this occupation's exposure to AI, how AI is
actually being used in it, and where employment is headed. These are positions
within published studies — measures of exposure and usage, not predictions
that this job will disappear.
Exposure to current AI
Each study uses its own scale, so the raw scores are not comparable across rows —
the percentile (this job's rank among all U.S. occupations with
data) is the comparable figure, and sizes the bars.
Measure
Rank vs all occupations
Percentile
Score
Overall AI exposure (Felten et al.) Moderate
51st
0.1
LLM task exposure, γ (OpenAI / Eloundou) Low
25th
0.2
AI assistant applicability (Microsoft) High
90th
0.3
OpenAI's exposure study scores tasks three ways: with a language model alone
(α 0.1), with simple added tooling
(β 0.1), and including AI-powered software
(γ 0.2). Higher means more of the job's
tasks could be done at least twice as fast — not that they will be automated away.
This job mostly cannot be done remotely (Dingel–Neiman) — its hands-on tasks sit outside what software-based AI reaches.
Historical automation estimate (2013)
A pre-LLM (2013) estimate of how automatable this job is by computerization and robotics. Shown for historical context only — it is not part of any current AI ranking.
Frey–Osborne probability 0.5 ·
47th percentile among occupations ·
Moderate
How AI is actually used in this job
Among measured AI assistant conversations mapped to this occupation (Anthropic
Economic Index, 2026-01-15), these
task types came up most. These are shares of observed AI conversations —
not shares of the job, of worker time, or of what could be automated.
Learn about competitors' products or consumers' interests or concerns to answer questions or provide more complete information.
2.1%
Prepare or alter presentation contents to target specific audiences.
2.1%
Suggest specific product purchases to meet customers' needs.
1.6%
Demonstrate or explain products, methods, or services to persuade customers to purchase products or use services.
0.3%
Job outlook
Independent U.S. Bureau of Labor Statistics employment projection for 2024–2034 —
a labor-market forecast, not an AI-impact forecast.
Outlook
Declining · -0.1% by 2034
Projected annual openings
14,000
Employment 2024 → 2034
79,200 → 79,100
“Annual openings” counts new jobs plus replacements for workers who leave the
occupation, so it can be large even when growth is modest.
Where this work sits on the global GenAI gradient
The ILO's 2025 global study scores generative-AI exposure on the international ISCO-08
occupation system, not US SOC. Bridged through the published (and approximate,
many-to-many) IBS O*NET-SOC ↔ ISCO-08 crosswalk, this US occupation corresponds to the
international occupation below. Exposure here means how much of the work's tasks today's AI can attempt — task
overlap, not automation, adoption, or jobs lost.
Demonstrators and Product Promoters sits at the 79th percentile of 427
occupations on the global GenAI task-exposure gradient
— exposure eased from 2023 to 2025. Each dot is one occupation; the
ringed one is this work. Exposure is task overlap, not automation or jobs lost.
Read the whole six-band gradient on the GenAI exposure gradient page.
The crosswalk is approximate: a US occupation can map to several international ones, and the
ILO scores describe the international occupation, not this exact US role.
Working with AI in this job
How people actually apply AI to this occupation's tasks, from Claude.ai (Free and Pro) conversations in the Anthropic Economic
Index, 2026-01-15. This is one AI
assistant's consumer sample — not all AI, not the whole workforce. Autonomy and the
collaboration mix are model-rated estimates; figures below the sample floor are hidden.
Augmentation vs. automation
48.2% working with AI · 43.6% handed to AI
Most common way people use AI here
Directive · AI does it; you give the instruction
Typical AI autonomy
4.0 / 5
· higher = AI acts more independently
Used for work (vs. personal / coursework)
14.6%
What people delegate to AI
The role's most common tasks in AI conversations, each tagged with how people work
with the AI on it. “Usage” is the share of observed conversations, not of
the job.
Task
How
Usage
Suggest specific product purchases to meet customers' needs.
Directive
2.8%
Demonstrate or explain products, methods, or services to persuade customers to purchase products or use services.
Iteration
2.2%
Provide product information, using lectures, films, charts, or slide shows.
Directive
0.9%
Prepare or alter presentation contents to target specific audiences.
Iteration
0.6%
Where a human is still needed
Tasks where the model most often judged that a person remained necessary — a useful
read on the current boundary, not a guarantee.
Demonstrate or explain products, methods, or services to persuade customers to purchase products or use services.
100.0%
Prepare or alter presentation contents to target specific audiences.
100.0%
Suggest specific product purchases to meet customers' needs.
99.6%
Provide product information, using lectures, films, charts, or slide shows.
98.9%
What people most often hand AI here
Example prompts phrased from the tasks people most often delegate to AI in this
occupation (Anthropic Economic Index). Each shows the underlying measured task and its
share of observed AI use. They are suggested phrasings of real tasks — starting points,
not endorsed instructions.
Help me suggest specific product purchases to meet customers' needs.
From: Suggest specific product purchases to meet customers' needs. · 2.8% of measured AI use · directive
Help me demonstrate or explain products, methods, or services to persuade customers to purchase products or use services.
From: Demonstrate or explain products, methods, or services to persuade customers to purchase products or use services. · 2.2% of measured AI use · task iteration
Help me provide product information, using lectures, films, charts, or slide shows.
From: Provide product information, using lectures, films, charts, or slide shows. · 0.9% of measured AI use · directive
Help me prepare or alter presentation contents to target specific audiences.
From: Prepare or alter presentation contents to target specific audiences. · 0.6% of measured AI use · task iteration
Tasks
All 24 tasks O*NET lists for this occupation, ordered by importance.
Each links to its own page with AI-exposure and observed-use detail.
How characteristic each condition is of the job, on O*NET's 1–5 context scale
(higher = more present in day-to-day work). Each condition links to how it varies
across all occupations.
Some occupations may need little or no previous experience; others require several months to a year of experience. For example, landscaping and groundskeeping workers might require very little training or previous experience, while agricultural equipment operators can benefit from on-the job training.
Preparation level
SVP (Below 6.0) — total schooling plus on-the-job experience.
Annual wages by percentile — U.S. (BLS OEWS). The light
band spans the 10th–90th percentile; the darker band is the middle half (25th–75th); the line
is the median.
Projected U.S. employment, 2024–2034 (BLS Employment Projections). A labor-market forecast for
the occupation, not an AI-impact forecast.
10th percentile
$30,910
25th percentile
$33,860
Median (50th)
$37,960
75th percentile
$50,100
90th percentile
$60,320
People employed
64,770
Industries that employ this occupation
Where these workers are employed, by number of jobs (national, BLS OEWS). Pay shown is
the occupation's national median, not industry-specific.
Industries where this occupation is far more common than in the economy as a whole.
The location quotient is how many times more concentrated it is here (a value of 5
means five times its economy-wide share).
AI task-overlap percentile (horizontal) vs. median-pay percentile (vertical), across all scored occupations. This occupation is highlighted; related occupations are plotted alongside it. Overlap measures shared tasks with AI, not automation.
Side-by-side comparisons place two occupations’ pay, preparation, skills, and AI
exposure on the same page — same data, same scale, no forecast.
What you can do with this
Options the data surfaces for Demonstrators and Product Promoters — not advice or a forecast. Each is a real
cross-link you can follow into the evidence.
Skills that travel
Capabilities this work builds that are used across many other occupations.
▸Write a report on thisheadline · factoids · citation
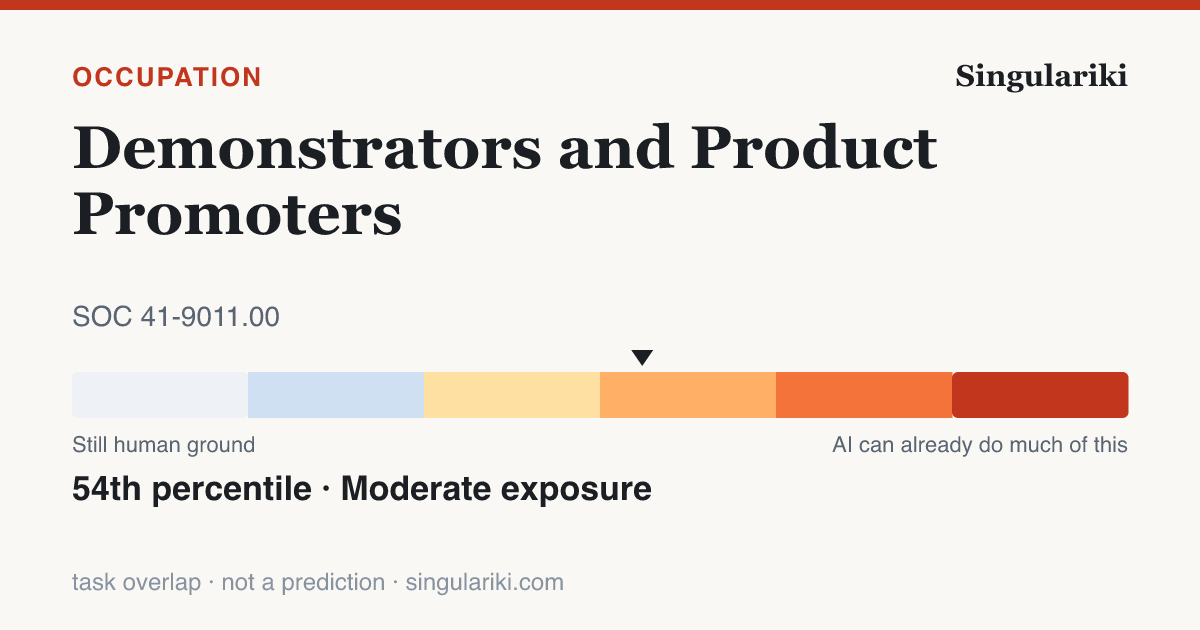
Demonstrators and Product Promoters show 54th-percentile AI task overlap — and about 14,000 annual U.S. openings
Demonstrators and Product Promoters rank in the 54th percentile (Moderate band) for AI task overlap across U.S. occupations — a measure of how much of the work today's AI can attempt, not how much is automated.Eloundou et al. (GPTs are GPTs) + Felten AIOE
The occupation is projected to see about 14,000 U.S. job openings per year (2024–34), counting growth and replacement — a labor-demand projection made independently of AI.BLS Employment Projections 2024–34
BLS projects employment to be declining (-0.1%) from 2024 to 2034.BLS Employment Projections 2024–34
Median annual pay is $37,960, across about 64,770 U.S. workers.BLS OEWS (May 2024)
Of the AI use actually observed for this work, 48% looks like augmentation (drafting, iterating, checking) rather than hands-off automation — from a Claude.ai usage sample, not a census.2026-01-15-v4-plus-2025-03-27-v2
Copy the whole kit
Demonstrators and Product Promoters show 54th-percentile AI task overlap — and about 14,000 annual U.S. openings

• Demonstrators and Product Promoters rank in the 54th percentile (Moderate band) for AI task overlap across U.S. occupations — a measure of how much of the work today's AI can attempt, not how much is automated. (Eloundou et al. (GPTs are GPTs) + Felten AIOE)
• The occupation is projected to see about 14,000 U.S. job openings per year (2024–34), counting growth and replacement — a labor-demand projection made independently of AI. (BLS Employment Projections 2024–34)
• BLS projects employment to be declining (-0.1%) from 2024 to 2034. (BLS Employment Projections 2024–34)
• Median annual pay is $37,960, across about 64,770 U.S. workers. (BLS OEWS (May 2024))
• Of the AI use actually observed for this work, 48% looks like augmentation (drafting, iterating, checking) rather than hands-off automation — from a Claude.ai usage sample, not a census. (2026-01-15-v4-plus-2025-03-27-v2)

Source: Singulariki — "Demonstrators and Product Promoters". https://singulariki.com/roles/role-41-9011-00
Note: AI task overlap measures what today's AI can attempt, not automation, job loss, or a forecast.
Every line is built only from figures this page already shows and cites. AI task overlap means
what today's AI can attempt — not automation, job loss, or a forecast.
Sources for this page
Every figure above traces to a named public dataset and the exact release below — not
hand-written opinion. See the full methodology for what each
measure does and does not mean.
O*NET 30.3U.S. Department of Labor / National Center for O*NET Development
Data compiled June 2, 2026. Figures are estimates, not advice.
Cite this page
Plain
Singulariki. "Demonstrators and Product Promoters." Singulariki: a source-backed encyclopedia of work. Built from O*NET 30.3; BLS Occupational Employment and Wage Statistics (OEWS) May 2024; BLS Employment Projections 2024–2034; Anthropic Economic Index v4 (2026-01-15) + v2 (2025-03-27); Microsoft “Working with AI” working-with-ai; “GPTs are GPTs” (Eloundou et al.) arXiv 2303.10130; AI Occupational Exposure (AIOE) Felten, Raj & Seamans; ILO / Gmyrek et al. GenAI exposure gradient 2025; IBS O*NET-SOC ↔ ISCO-08 occupation crosswalk 2022; Frey & Osborne (2013) frey-osborne-automation; Dingel & Neiman (2020) dingel-neiman-workathome. Accessed June 7, 2026. https://singulariki.com/roles/role-41-9011-00
APA
Singulariki. (2026). Demonstrators and Product Promoters. Singulariki: a source-backed encyclopedia of work. Retrieved June 7, 2026, from https://singulariki.com/roles/role-41-9011-00
BibTeX
@misc{singulariki-role-41-9011-00,
  title  = {Demonstrators and Product Promoters},
  author = {{Singulariki}},
  year   = {2026},
  note   = {O*NET 30.3; BLS Occupational Employment and Wage Statistics (OEWS) May 2024; BLS Employment Projections 2024–2034; Anthropic Economic Index v4 (2026-01-15) + v2 (2025-03-27); Microsoft “Working with AI” working-with-ai; “GPTs are GPTs” (Eloundou et al.) arXiv 2303.10130; AI Occupational Exposure (AIOE) Felten, Raj & Seamans; ILO / Gmyrek et al. GenAI exposure gradient 2025; IBS O*NET-SOC ↔ ISCO-08 occupation crosswalk 2022; Frey & Osborne (2013) frey-osborne-automation; Dingel & Neiman (2020) dingel-neiman-workathome. Accessed June 7, 2026},
  url    = {https://singulariki.com/roles/role-41-9011-00}
}
Citations name the underlying public dataset releases — they reflect what this page is built from, not just the URL.
Embed this chart
Paste this into any page. It links back here for attribution.